
UNITED STATES
SECURITIES AND EXCHANGE COMMISSION
Washington, D.C. 20549
FORM 6-K
Report of Foreign Private Issuer
Pursuant to Rule 13a-16 or 15d-16 under the
Securities Exchange Act of 1934
For the month of November 2026
Commission File Number: 001-14014
CREDICORP LTD.
(Translation of registrant’s name into English)
Of our subsidiary
Banco de Credito del Peru:
Calle Centenario 156
La Molina 15026
Lima, Peru
(Address of principal executive office)
Indicate by check mark whether the registrant files or will file annual reports under cover of Form 20-F or Form 40- F.
Form 20-F ☒ Form 40-F ☐
The information in this Form 6-K (including any exhibit hereto) shall not be deemed “filed” for purposes of Section 18 of the Securities Exchange Act of 1934 (the “Exchange Act”) or otherwise subject to the liabilities of that section, nor shall it be deemed incorporated by reference in any filing under the Securities Act of 1933 or the Exchange Act.
SIGNATURE
Pursuant to the requirements of the Securities Exchange Act of 1934, the registrant has duly caused this report to be signed on its behalf by the undersigned, thereunto duly authorized.
Date: November 10, 2026
CREDICORP LTD. (Registrant) | |||||||||||
| By: | /s/ Milagros Cigüeñas | ||||||||||
| Milagros Cigüeñas | |||||||||||
| Authorized Representative | |||||||||||

 | | | Earnings Release 3Q / 2026 | Analysis of 3Q26 Consolidated Results | ||||||||
Table of Contents

2
| | | Earnings Release 3Q / 2026 | Analysis of 3Q26 Consolidated Results | ||||||||
Credicorp Ltd. Reports Financial and Operating Results for 3Q26
3Q26 ROE of 19.9%, supported by loan growth, healthy asset quality and diversified revenues; FY26 guidance of ~19.5% and the medium-term expectation of ~22% reaffirmed.
Loans up 14.8% YoY and the NPL ratio improved -91 bps to 3.9%; CoR was 2.0%, including additional El Niño provisions, reflecting the updated quarter-end El Niño assessment, while NPL coverage rose to 120.9%.
Core income reached a new quarterly high, up 18.0% YoY, with Risk-Adjusted NIM improving to 5.7% on margin expansion and transactional deposits growth.
Innovation Portfolio contributed 10.7% of Credicorp’s risk-adjusted revenues, while
Yape’s contribution rose to 9.8% as monetization accelerated.
Yape’s contribution rose to 9.8% as monetization accelerated.
Efficiency improved -26 bps YoY to 45.4% in 9M26, reflecting operating leverage alongside continued strategic investment.
Lima, Peru – November 9, 2026 – Credicorp Ltd. (“Credicorp” or “the Company”) (NYSE: BAP | BVL: BAP), the leading financial services holding company in Peru with a presence in Chile, Colombia, Bolivia, and Panama today reported its unaudited results for the three- and nine-months ended September 30, 2026. Financial results are expressed in Soles and are presented in accordance with IFRS.
3Q26 OPERATING AND FINANCIAL HIGHLIGHTS
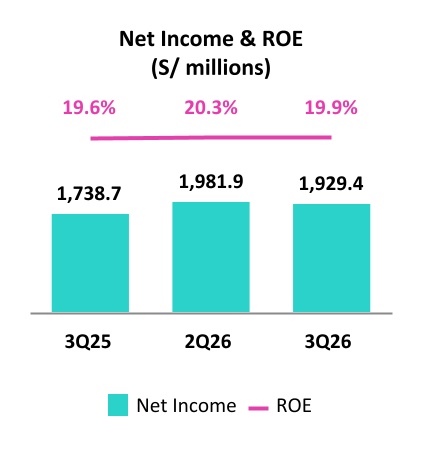
•Net income attributable to Credicorp reached S/1,929.4 million, up 11.0% YoY and down 2.6% QoQ, resulting in ROE of 19.9%, driven by accelerating loan growth, healthy asset quality and diversified revenue growth fueled by strong transactional activity and continued investment in digital capabilities.
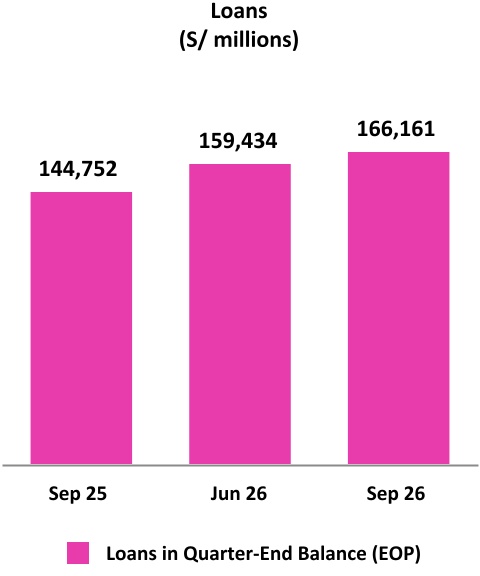
•Total loans measured in quarter-end balances increased 14.8% YoY (15.2% FX-neutral) and 4.2% QoQ (4.0% FX-neutral). YoY growth was led by BCP’s Retail Banking, particularly Consumer and SME-Pyme, followed by Wholesale Banking, and to a lesser extent Mibanco. QoQ expansion reflected growth in BCP’s same segments and at Mibanco, where disbursements reached a record high in September.
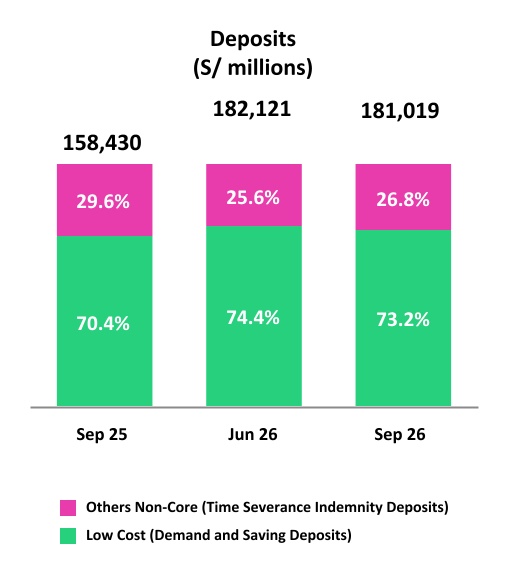
•Total Deposits increased 14.3% YoY (14.8% FX-neutral) but declined 0.6% QoQ (0.9% FX-neutral). YoY growth was supported mainly by low-cost deposits, which represented 73.2% of total deposits and 62.0% of the funding base. The sequential decline reflected the normalization of a temporary Wholesale demand deposit recorded at 2Q26-end and partial migration from demand to time deposits.
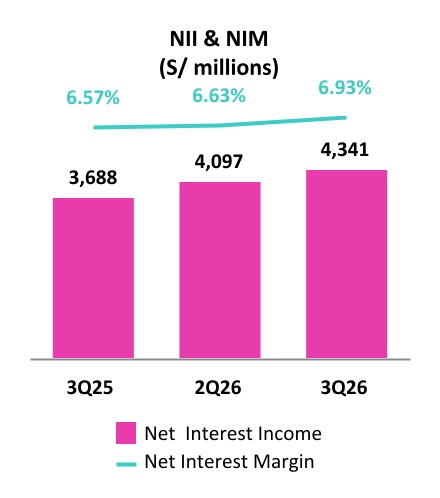
•Net Interest Income (NII) increased 17.7% YoY and 6.0% QoQ, primarily driven by loan growth at BCP and Mibanco, particularly in higher-yielding segments. Net Interest Margin (NIM) expanded 36 bps YoY to 6.9%, as the yield on interest-earning assets rose to 8.8% and growth in low-cost deposits reduced the funding cost to 2.2%.
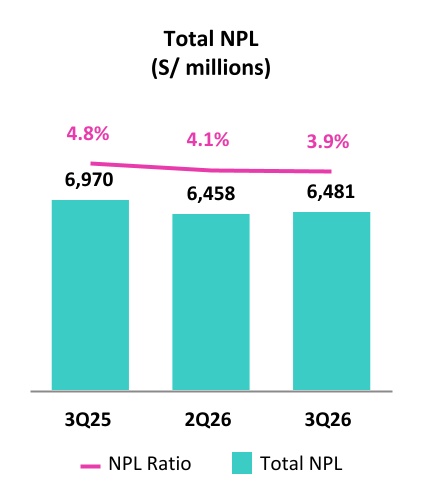
•Asset Quality continued to improve, with the NPL ratio declining -91 bps YoY and -15 bps QoQ to 3.9%. Performance registered stronger origination, monitoring and collections capabilities, particularly at BCP Stand-alone, reflecting positive payment behavior and healthy vintages.
•Provisions increased 37.4% YoY and 13.3% QoQ, reflecting additional provisioning after the El Niño risk assessment evolved to a “Very Strong” base scenario at quarter-end, with a Cost of Risk standing at 2.0%. YoY, underlying provisions increased alongside loan growth at BCP and Mibanco, reflecting a greater contribution from higher-yielding portfolios. Cost of Risk stood at 2.0%, NPL coverage strengthened to 120.9%, while Risk-Adjusted NIM improved 13 bps to 5.7%.
•Other Core Income increased 18.8% YoY and 3.2% QoQ, rising to 29.3% of total risk-adjusted income as Credicorp continues to diversify revenues. Growth was led by increases of 20.4% and 14.3% in fee income and FX gains, respectively.
•Insurance Underwriting Result declined 6.7% YoY, reflecting a tough comparison in Life’s D&S line following SISCO reserve releases in 3Q25, partially offset by stronger P&C results. QoQ, results increased 25.8% driven by higher
3
| | | Earnings Release 3Q / 2026 | Analysis of 3Q26 Consolidated Results | ||||||||
premiums and lower claims in Life and P&C, together with Corporate Health revenue growth from new accounts and renewals. Medical Services maintained solid commercial performance and disciplined expense management.
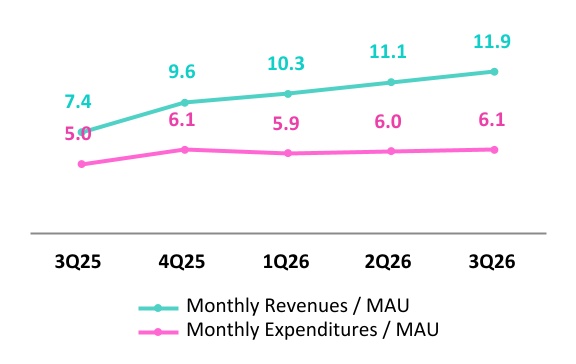
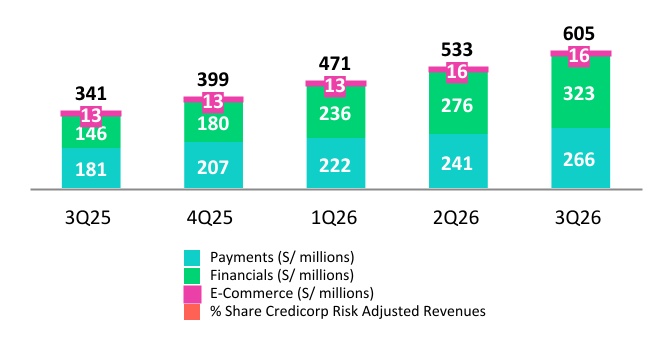
•Yape further consolidated its position as Peru’s leading digital ecosystem, as deeper day-to-day engagement translated into continued monetization gains. MAU rose 9.8% YoY to 17.0 million, while transactions grew 35.1% YoY, averaging 71 per MAU per month. Revenue per MAU rose to S/11.9, nearly twice expenses per MAU of S/6.1, raising Yape’s contribution to Credicorp’s risk-adjusted revenues to 9.8%, from 6.4% in 3Q25. Meanwhile, loans nearly quadrupled YoY to S/2.3 billion, with lending representing 31% of Yape’s risk-adjusted revenues.
•Efficiency Ratio improved 26 bps YoY to 45.4% in 9M26, remaining within 2026 guidance. Operating expenses increased 13.6% YoY for the first nine months this year, mainly reflecting continued investment in BCP’s commercial, technology and risk-management capabilities, and higher variable compensation aligned with stronger results. Innovation portfolio expenses rose 32.5%, supporting continued growth in risk-adjusted revenues.
•Solid capital base, with IFRS CET1 ratios at 11.9% for BCP Stand-alone and 15.1% for Mibanco.
4
| | | Earnings Release 3Q / 2026 | Analysis of 3Q26 Consolidated Results | ||||||||
SENIOR MANAGEMENT QUOTES
 |  | |||||||||||||
| “ | ||||||||||||||
| “Credicorp delivered another strong quarter, reflecting solid performance across our businesses and a broader earnings base. Our innovation portfolio contributed 10.7% of risk-adjusted revenues, already exceeding our year-end target. Peru’s economy continues to build momentum, supported by domestic demand, private investment and a strong macro backdrop. However, the expected intensity of El Niño has increased, shifting our quarter-end base case to a Very Strong scenario. We prepared early by strengthening contingency plans and moderating origination in vulnerable consumer and SME segments and stand ready to support families, businesses and communities through potential disruptions. Our results reinforce our confidence in Credicorp’s ability to fulfill that responsibility while generating sustainable returns, with a medium-term ROE of around 22%. At our November 17 Strategic Update, we will discuss how the capabilities of our integrated ecosystem can support our next phase of growth, operating leverage and sustainable returns.” | ||||||||||||||
| Gianfranco Ferrari, CEO | ” | |||||||||||||
 |  | |||||||||||||
 |  | |||||||||||||
| “ | ||||||||||||||
| Credicorp delivered a 19.9% ROE in the third quarter, supported by accelerating loan growth, robust revenues and healthy underlying credit trends. Importantly, this result includes provisions based on our quarter-end assessment of El Niño risk. Loan growth in higher-yielding segments supported net interest income and margins, while our investments in digital capabilities fueled strong transactional activity driving low-cost funding advantage and fee income. Core income growth also supported improved efficiency, demonstrating the increasing scalability of our business model. Asset quality remained sound, supported by improved origination and collection capabilities, while our robust capital position provides capacity to absorb potential volatility. As we enter the final quarter, we remain focused on profitable growth and disciplined risk management. We remain on track to deliver our 2026 ROE guidance of around 19.5%. | ||||||||||||||
| Ignacio Belaunde, CFO | ” | |||||||||||||
 |  | |||||||||||||
5
 | | | Earnings Release 3Q / 2026 | Analysis of 3Q26 Consolidated Results | ||||||||
Third Quarter 2026 Earnings Conference Call | |||||||||||
THIRD QUARTER 2026 EARNINGS CONFERENCE CALL
Date: Tuesday, November 10th, 2026
Time: 9:30 am E.T. (9:30 am Lima, Perú)
Hosts: Gianfranco Ferrari – Chief Executive Officer; Ignacio Belaunde – Chief Financial Officer; Francesca Raffo – Chief Innovation Officer; Cesar Rios – Chief Risk Officer; Diego Cavero – Head of Universal Banking and CEO of BCP; Eduardo Montero – Head of Insurance and Pensions and CEO of Pacífico; Rocio Benavides - CFO of Mibanco and the Investor Relations Team.
To pre-register for the listen-only webcast presentation use the following link:
https://dpregister.com/DiamondPassRegistration/register?confirmationNumber=10212780&linkSecurityString=1051f96b8f4
Callers who pre-register will be given a conference passcode and unique PIN to gain immediate access to the call and bypass the live operator. Participants may pre-register at any time, including up to and after the call start time.
Those unable to pre-register may dial in by calling:
1 844 435 0321 (U.S. toll free)
1 412 317 5615 (International)
Participant Web Phone: Click Here
Conference ID: Credicorp Conference Call
The webcast will be archived for one year on our investor relations website at:
https://credicorp.gcs-web.com/events-and-presentations/upcoming-events
For a full version of Credicorp´s Second Quarter 2026 Earnings Release, please visit:
https://credicorp.gcs-web.com/company-reports/quarterly-materials
6
| | | Earnings Release 3Q/ 2026 | Analysis of 3Q26 Consolidated Results | ||||||||
Loans in Quarter-End Balances
Total loans (measured in quarter-end balance) expanded 4.2% QoQ and 14.8% YoY.
If we exclude the exchange rate effect, total loans rose 4.0% QoQ and 15.2% YoY.
QoQ growth was driven mainly by: (i) an uptick in loans in Consumer and SME-Pyme at BCP; (ii) an increase in short-term loan issuances in Wholesale Banking at BCP; and (iii) loan growth at Mibanco, with loan disbursement volumes reaching a record high in September.
YoY, the evolution was driven mainly by: (i) expansion in most Retail Banking segments at BCP; (ii) growth in short and long term lending in Wholesale Banking at BCP; and (iii) solid loan growth at Mibanco.
Deposits
The total deposit balance (measured in quarter-end balances) dropped 0.6% QoQ, but rose 14.3% YoY.
The QoQ decline mainly reflected the normalization of a temporary Wholesale deposit. YoY, growth was spurred by expansion in the balance for low-cost deposits, which represented 73.19% of total deposits at the end of September (+281 bps YoY). This evolution attests to the strength of our transactional proposition and our capacity to capture deposits in a high-liquidity environment.
At BCP, the Liquidity Coverage Ratio (RCL) in PEN at 30 days stood at 162.7% under regulatory standards and 142.3% by stricter internal standards. The LCR in USD at 30 days stood at 144.0% under regulatory standards and 110.5% under stricter internal standards.
| ▲ | ||
4.2% QoQ | ||
| ▲ | ||
14.8% YoY | ||
| ▼ | ||
| -0.6% QoQ | ||
| ▲ | ||
| 14.3% YoY | ||
7
| | | Earnings Release 3Q/ 2026 | Analysis of 3Q26 Consolidated Results | ||||||||
Net Interest Income (NII) and Margin (NIM)
QoQ, Net Interest Income (NII) increased 6.0%. This result was mainly driven by an increase in Income and Similar Interest, which rose on the back of an increase in interest on Loans after volumes ticked up at BCP and Mibanco. Growth in NII was partially offset by an increase in Interest and similar expenses, which grew alongside growth in time deposits.
YoY, NII increased 17.7%. This evolution was mainly triggered by an increase in Interest and similar income, which rose alongside an uptick in loans (through the same drivers seen QoQ). This uptick was partially offset by Interest and similar expenses, which ticked up on the back of growth in time deposits. In this context, NIM rose 36 bps YoY to stand at 6.93% at the end of 3Q26.
Portfolio Quality and Cost of Risk
Asset quality continued to evolve favorably, backed by improvements in the origination and heightened capacities for monitoring, collections and recovery.
QoQ, NPLs rose 0.4%, which was driven by loan growth at BCP Stand-alone’s retail portfolio and Mibanco. The latter was attenuated by the favorable evolution of Wholesale Banking at BCP Stand-alone.
YoY, the NPL portfolio dropped 7.0%. This evolution was attributable to BCP Stand-alone, which registered improvements in payment dynamics and better performance for recent vintages in Retail Banking.
In a context of solid loan growth, Credicorp’s NPL ratio dropped -15 bps QoQ to stand at 3.9%.
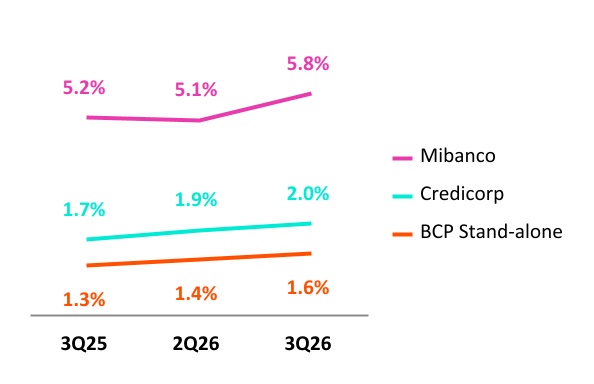
Provisions rose 13.3% QoQ and 37.4% YoY, partially driven by our risk assessment of the El Niño Phenomenon, with a “Very Strong” event becoming our base-case scenario at quarter-end. The Cost of Risk (CoR) for the period stood at 2.0%.
Underlying provisions were relatively stable QoQ, as higher provisions in BCP Retail Banking and Mibanco were offset by improved performance in BCP Wholesale Banking.
YoY, underlying provisions increased, driven primarily by BCP Stand-alone and, to a lesser extent, Mibanco. In both cases, higher provisions mainly reflected loan growth.
| ▲ | ||
6.0% QoQ | ||
| ▲ | ||
17.7% YoY | ||
| ▲ | ||
0.4% QoQ | ||
| ▼ | ||
-7.0% YoY | ||
Cost of Risk (%)
| 110.1% | 117.3% | 120.9% | NPL Coverage Ratio | |||||||||||||||||||||||||||||
8
| | | Earnings Release 3Q/ 2026 | Analysis of 3Q26 Consolidated Results | ||||||||
Other Income
Other Core income rose 3.2% QoQ and 18.8% YoY, mainly driven by higher fee income as transaction volumes increased. FX gains normalized QoQ after two strong quarters, while increasing YoY on higher transaction volumes and improved pricing.
Insurance Underwriting Result
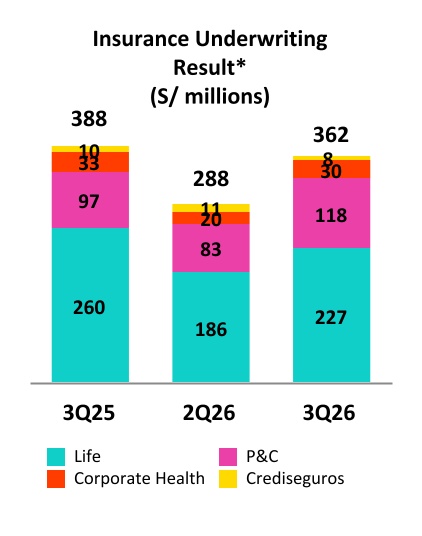
The Insurance Underwriting Result (IUR) increased 25.8% QoQ, fueled by (i) Life, which reported growth in premiums and a reduction in claims for the business’s main products; (ii) Corporate Health, which reported growth in revenues from new accounts and renewals; and (iii) P & C, which reported an uptick in total premiums and a drop in claims. YoY, the IUR fell (-6.7%). This evolution was driven by Life, mainly through the D&S line, which reported a base effect associated with releases of reserves for SISCO claims in 3Q25. The drop in Life’s result was partially offset by an uptick for P & C, which was driven by growth in premium production and a drop in the loss ratio for Medical Assistance.
Medical Services continues to report solid commercial results, while maintaining disciplined expense management.
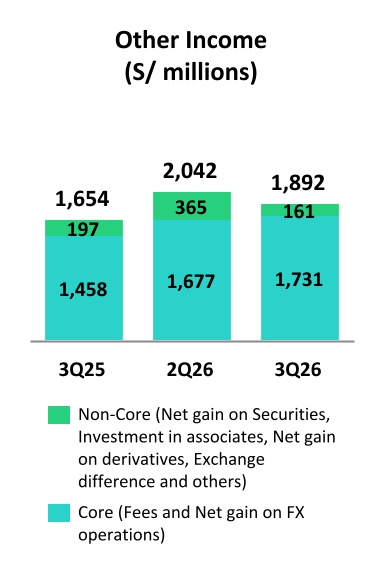
| Total | Core | ||||
| ▼ | ▲ | ||||
-7.4% QoQ | 3.2% QoQ | ||||
| ▲ | ▲ | ||||
14.4%YoY | 18.8%YoY | ||||
| ▲ | ||
25.8% QoQ | ||
| ▼ | ||
-6.7% YoY | ||
9
| | | Earnings Release 3Q/ 2026 | Analysis of 3Q26 Consolidated Results | ||||||||
Efficiency
Operating expenses increased 13.6% for the first nine months of the year, fueled primarily by an increase in Administrative Expenses, and secondarily, an uptick in the Employee Salaries and Benefits line. Administrative Expenses increased mainly due to higher technology costs at BCP, reflecting greater cloud usage and other IT-related services as transaction volumes grew. Employee Salaries and Benefits increased as BCP continued to strengthen its technology, commercial and risk management capabilities, and due to higher variable compensation at BCP and Mibanco, in line with improved results. Expenses for our innovation portfolio increased 32.5%, supporting continued growth in risk-adjusted revenues.
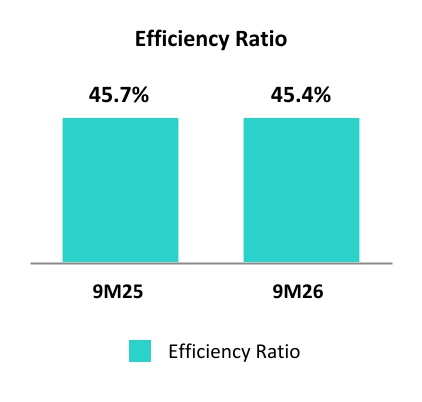
Operating Income rose 14.3% YTD. In this context, the Efficiency Ratio stood at 45.4% for the first nine months of the year, in line with this year’s guidance.
Net earnings attributable to Credicorp
In 3Q26, net earnings attributable to Credicorp stood at S/1,929.4 million (-2.6% QoQ and +11.0% YoY), which translated into an ROE of 19.9% for the quarter. This evolution was backed by solid results in all our lines of business. For the first nine months of the year, Credicorp reported net attributable earnings of S/5,974.5 million (+11.9% YTD). This evolution was supported by the strength of our integrated business ecosystem and favorable economic conditions. In this context, ROE stood at 20.4% for the first nine months this year.
| ▼ | ||
-2.6% QoQ | ||
| ▲ | ||
11.0% YoY | ||
Contributions and ROE by Subsidiary in 3Q26
(S/ million)
| ROE | ROE | ROE | ROE | ROE | ROE | ROE | ROE | ROE | ||||||||||||||||||||||||||||||||||||||||||||||||||||||
| 27.7% | 15.2% | 20.0% | 18.4% | 20.6% | 27.9% | 9.5% | 16.0% | 19.9% | ||||||||||||||||||||||||||||||||||||||||||||||||||||||
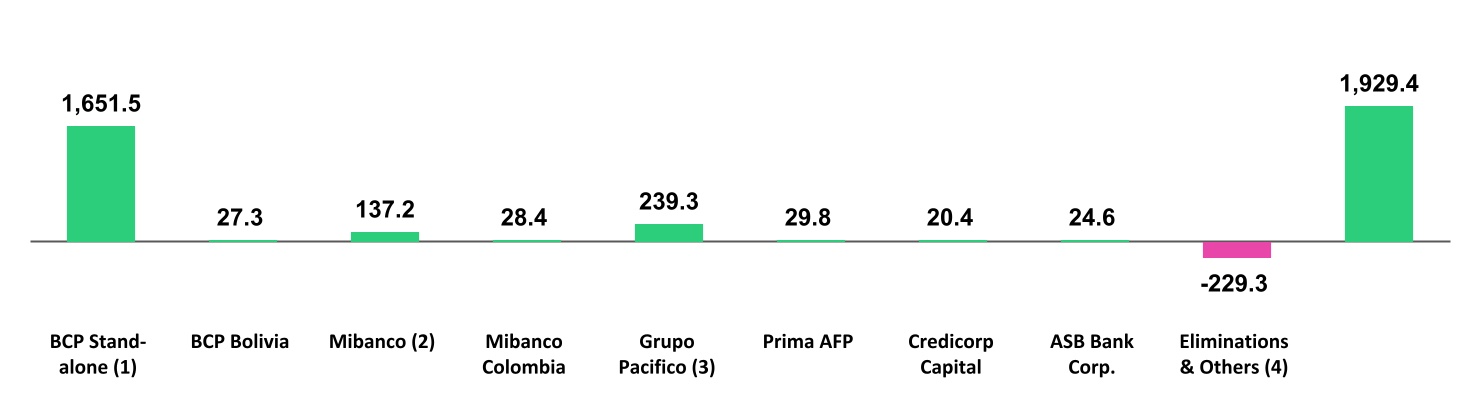
(1)In BCP Stand-alone, the figure is lower than the net profit since the contribution eliminates investment gains in other subsidiaries of Credicorp (Mibanco)
(2)In Mibanco, the figure is less than the net profit because Credicorp owns (directly and indirectly) 99.921% of Mibanco.
(3)The contribution for Grupo Pacifico presented here is greater than the profit of Pacifico Seguros since 100% of Crediseguros is being included (including 48% under Grupo Crédito).
10
| | | Earnings Release 3Q/ 2026 | Analysis of 3Q26 Consolidated Results | ||||||||
Universal Banking | ||||||||
| Solid performance is driven by growth, diversified revenue streams and disciplined risk management | │ | BCP continued to report solid profitability, which was supported by loan growth; an increase in the margin; higher transactional income; and healthy underlying credit trends. Growth was led by Retail Banking, while NIM increased on the back of a drop in the funding cost and an increase in the share of higher-yield assets. Asset quality continued to improve due to improvements in origination and collections capacities. Provisions increased, partly reflecting additional provisions following our assessment of El Niño risk as of quarter-end. Underlying credit trends remain healthy, within expectations. | ||||||
Microfinance | ||||||||
| Loan Growth, efficiency gains and disciplined risk management fuel profitability | │ | Mibanco continued to evolve positively, backed by loan growth, an uptick in the margin, operating leverage and disciplined risk management. Provisions trended upwards reflecting our reassessment of El Niño risk at quarter end, while the performance of the underlying credit remained healthy. Growth in fee income from insurance, which rose alongside loan expansion, contributed to revenue diversification and the efficiency ratio continued to improve. Mibanco Colombia registered solid performance, supported by growth in the client base; disciplined risk management; and improvements in commercial productivity. | ||||||
| Insurance & Pensions | ||||||||
| Sustained profitability supported by business fundamentals | │ | Grupo Pacífico maintained robust profitability, driven mainly by growth in the Life Business, which was led by Annuities and Individual Life. Corporate Health also contributed to expansion through an increase in both premium production and the client base. Medical Services, in turn, remained stable. These results were partially offset by a drop in P & C’s performance, which was mainly attributable to the Commercial Lines and Cars. | ||||||
Investment Management & Advisory | ||||||||
| Recurring Revenue Growth Underpins Profitability | │ | Investment Management and Advisory’s profitability remained resilient, bolstered by the favorable performance of its recurring businesses. YoY, the Capital Markets business was the main revenue contributor this quarter, where expansion was led by an uptick in volumes of FX transactions. Asset and Wealth Management acted as secondary driver, buoyed by expansion in assets under management (AUMs). This evolution was more than offset by an uptick in operating expenses. | ||||||
Outlook | |||||
We reaffirm our 2026 ROE guidance of around 19.5%. This outlook is supported by stronger loan growth, NIM and risk-adjusted NIM trending toward the high end of guidance, and stronger fee income. We reaffirm our medium-term ROE guidance of around 22%. | |||||
11
| | | Earnings Release 3Q / 2026 | Analysis of 3Q26 Consolidated Results | ||||||||
Financial Overview | |||||||||||
| Credicorp Ltd. | Quarter | % Change | Up to | % Change | ||||||||||||||||||||||
| S/ 000 | 3Q25 | 2Q26 | 3Q26 | QoQ | YoY | Sep 25 | Sep 26 | Sep 26 / Sep 25 | ||||||||||||||||||
| Net interest, similar income and expenses | 3,687,829 | 4,096,951 | 4,341,124 | 6.0% | 17.7% | 10,875,212 | 12,400,802 | 14.0% | ||||||||||||||||||
| Provision for credit losses on loan portfolio, net of recoveries | (602,918) | (731,208) | (828,136) | 13.3% | 37.4% | (1,759,970) | (2,041,432) | 16.0% | ||||||||||||||||||
| Net interest, similar income and expenses, after provision for credit losses on loan portfolio | 3,084,911 | 3,365,743 | 3,512,988 | 4.4% | 13.9% | 9,115,242 | 10,359,370 | 13.6% | ||||||||||||||||||
| Other income | 1,654,191 | 2,042,202 | 1,891,679 | -7.4% | 14.4% | 5,021,780 | 5,790,205 | 15.3% | ||||||||||||||||||
| Insurance underwriting result | 388,350 | 288,014 | 362,323 | 25.8% | -6.7% | 1,068,357 | 949,400 | -11.1% | ||||||||||||||||||
| Medical services result | 123,953 | 133,439 | 136,387 | 2.2% | 10.0% | 289,961 | 393,664 | 35.8% | ||||||||||||||||||
| Total expenses | (2,744,642) | (2,989,462) | (3,108,580) | 4.0% | 13.3% | (7,907,826) | (8,938,873) | 13.0% | ||||||||||||||||||
| Profit before income tax | 2,506,763 | 2,839,936 | 2,794,797 | -1.6% | 11.5% | 7,587,514 | 8,553,766 | 12.7% | ||||||||||||||||||
| Income tax | (728,308) | (814,357) | (820,898) | 0.8% | 12.7% | (2,129,746) | (2,444,146) | 14.8% | ||||||||||||||||||
| Net profit | 1,778,455 | 2,025,579 | 1,973,899 | -2.6% | 11.0% | 5,457,768 | 6,109,620 | 11.9% | ||||||||||||||||||
| Non-controlling interest | 39,800 | 43,657 | 44,488 | 1.9% | 11.8% | 119,401 | 135,103 | 13.2% | ||||||||||||||||||
| Net profit attributable to Credicorp | 1,738,655 | 1,981,922 | 1,929,411 | -2.6% | 11.0% | 5,338,367 | 5,974,517 | 11.9% | ||||||||||||||||||
| Dividends paid to third parties | — | 3,978,758 | — | n.a. | n.a. | 3,181,440 | 3,978,758 | 25.1% | ||||||||||||||||||
| Net income / share (S/) | 21.9 | 25.0 | 24.3 | -2.6% | 10.9% | 67.3 | 75.2 | 11.8% | ||||||||||||||||||
| Dividends per Share (S/) | — | 50 | — | n.a. | n.a | 40 | 50 | 25.0% | ||||||||||||||||||
| Loans | 144,752,254 | 159,434,397 | 166,161,042 | 4.2% | 14.8% | 144,752,254 | 166,161,042 | 14.8% | ||||||||||||||||||
| Deposits and obligations | 158,430,455 | 182,120,766 | 181,018,857 | -0.6% | 14.3% | 158,430,455 | 181,018,857 | 14.3% | ||||||||||||||||||
| Net equity | 36,560,502 | 38,121,924 | 39,629,260 | 4.0% | 8.4% | 36,560,502 | 39,629,260 | 8.4% | ||||||||||||||||||
| Profitability | ||||||||||||||||||||||||||
| Net interest margin (1) | 6.57% | 6.63% | 6.93% | 30 bps | 36 bps | 6.33% | 6.79% | 46 bps | ||||||||||||||||||
| Risk-adjusted Net interest margin | 5.53% | 5.49% | 5.66% | 17 bps | 13 bps | 5.34% | 5.71% | 37 bps | ||||||||||||||||||
| Funding cost (2) | 2.43% | 2.15% | 2.25% | 10 bps | -18 bps | 2.40% | 2.20% | -20 bps | ||||||||||||||||||
| ROAE | 19.6% | 20.3% | 19.9% | -44 bps | 27 bps | 20.1% | 20.4% | 35 bps | ||||||||||||||||||
| ROAA | 2.8% | 2.8% | 2.7% | -11 bps | -5 bps | 2.8% | 2.9% | 7 bps | ||||||||||||||||||
| Loan portfolio quality | ||||||||||||||||||||||||||
| Internal overdue ratio (3) | 3.4% | 2.8% | 2.7% | -10 bps | -69 bps | 3.4% | 2.7% | -69 bps | ||||||||||||||||||
| Internal overdue ratio over 90 days | 2.9% | 2.3% | 2.2% | -7 bps | -64 bps | 2.9% | 2.2% | -64 bps | ||||||||||||||||||
| NPL ratio (4) | 4.8% | 4.1% | 3.9% | -15 bps | -91 bps | 4.8% | 3.9% | -91 bps | ||||||||||||||||||
| Cost of risk (5) | 1.7% | 1.9% | 2.0% | 16 bps | 34 bps | 1.6% | 1.7% | 10 bps | ||||||||||||||||||
| Coverage ratio of IOLs | 154.9% | 168.2% | 172.5% | 432 bps | 1757 bps | 154.9% | 172.5% | 1757 bps | ||||||||||||||||||
| Coverage ratio of NPLs | 110.1% | 117.3% | 120.9% | 363 bps | 1083 bps | 110.1% | 120.9% | 1083 bps | ||||||||||||||||||
| Operating efficiency | ||||||||||||||||||||||||||
| Operating income (6) | 5,670,690 | 6,231,110 | 6,644,346 | 6.6% | 17.2% | 16,540,190 | 18,904,568 | 14.3% | ||||||||||||||||||
| Operating expenses (7) | 2,629,461 | 2,825,995 | 2,997,591 | 6.1% | 14.0% | 7,555,043 | 8,586,214 | 13.6% | ||||||||||||||||||
| Efficiency ratio (8) | 46.4% | 45.4% | 45.1% | -24 bps | -125 bps | 45.7% | 45.4% | -26 bps | ||||||||||||||||||
| Operating expenses / Total average assets | 4.2% | 4.0% | 4.2% | 19 bps | 4 bps | 3.9% | 4.1% | 23 bps | ||||||||||||||||||
| Capital adequacy - BCP Stand-alone | ||||||||||||||||||||||||||
| Global Capital Ratio (9) | 17.72% | 17.27% | 16.54% | -73 bps | -118 bps | 17.72% | 16.54% | -118 bps | ||||||||||||||||||
| Ratio Tier 1 (10) | 12.82% | 11.40% | 11.69% | 29 bps | -113 bps | 12.82% | 11.69% | -113 bps | ||||||||||||||||||
| Ratio common equity tier 1 (11) (12) | 13.17% | 11.70% | 11.92% | 23 bps | -125 bps | 13.17% | 11.92% | -125 bps | ||||||||||||||||||
| Capital adequacy - Mibanco | ||||||||||||||||||||||||||
| Global Capital Ratio (9) | 21.13% | 20.61% | 20.64% | 3 bps | -48 bps | 21.13% | 20.64% | -48 bps | ||||||||||||||||||
| Ratio Tier 1 (10) | 17.13% | 16.32% | 15.63% | -69 bps | -150 bps | 17.13% | 15.63% | -150 bps | ||||||||||||||||||
| Ratio common equity tier 1 (11) (12) | 17.14% | 15.90% | 15.14% | -76 bps | -201 bps | 17.14% | 15.14% | -201 bps | ||||||||||||||||||
| Employees (13) | 50,169 | 52,770 | 53,496 | 1.4% | 6.6% | 50,169 | 53,496 | 6.6% | ||||||||||||||||||
| Share Information | ||||||||||||||||||||||||||
| Issued Shares | 94,382 | 94,382 | 94,382 | —% | —% | 94,382 | 94,382 | —% | ||||||||||||||||||
| Treasury Shares (14) | 15,016 | 14,963 | 14,963 | —% | -0.4% | 15,016 | 14,963 | -0.4% | ||||||||||||||||||
| Outstanding Shares | 79,366 | 79,419 | 79,419 | —% | 0.1% | 79,366 | 79,419 | 0.1% | ||||||||||||||||||
(1) Net Interest Margin = Net Interest Income (Excluding Net Insurance Financial Expenses) / Average Interest Earning Assets
(2) Funding Cost = Interest Expense (Does not include Net Insurance Financial Expenses) / Average Funding
(3) Internal Overdue Loans: includes overdue loans and loans under legal collection, according to our internal policy for overdue loans. Internal Overdue Ratio: Internal overdue loans / Total loans
(4) Non-performing loans (NPL): Internal overdue loans + Refinanced loans. NPL ratio: NPL / Total loans.
(5) Cost of risk = Annualized provision forloan losses, net of recoveries/ Average Total loans.
(6) Operating Income = Net interest, similar income and expenses + Fee Income+ Net gain on foreign exchange transactions + Net Gain From associates + Net gain on derivatives held for trading + Result on exchange differences + Insurance Underwriting Result + Medical services result.
on exchange differences + Insurance Underwriting Result + Medical services result."
(7) Operating Expenses = Salaries and employee benefits + Administrative expenses + Depreciation and amortization + Association in participation + Acquisition cost.
(8) Efficiency Ratio = Operating Expenses / Operating Income.
(9) Regulatory Capital / Risk-weighted assets (legal minimum = 10% since July 2011).
(10) Tier 1 = Capital + Legal and other capital reserves + Accumulated earnings with capitalization agreement + (0.5 x Unrealized profit and net income in subsidiaries) - Goodwill - (0.5 x Investment in subsidiaries) + Perpetual subordinated debt (the maximum amount that can be included is 17.65% of Capital + Reserves + Accumulated earnings with capitalization agreement + Unrealized profit and net income in subsidiaries - Goodwill)
(11) Common Equity Tier I = Capital + Reserves – 100% of applicable deductions (investment in subsidiaries, goodwill, intangibles and net deferred taxes that rely on future profitability) + retained earnings + unrealized gains
(12) Common Equity Tier I calculated based on IFRS Accounting.
(13) Internal management figures. Since 1Q25, it has included corporate health and medical services employees.
(14) Considers shares held by Atlantic Security Holding Corporation (ASHC) and stock award.
12
| | | Earnings Release 3Q / 2026 | Analysis of 3Q26 Consolidated Results | ||||||||
Credicorp’s Strategy Update | |||||||||||
Credicorp’s Strategy
We invite you to learn more about the evolution of our strategy execution and our outlook at our Strategic Update event, which will be held on November 17, 2026 at 9:00 a.m. EST/PET. You can register here: Strategic Update 2026.
Credicorp has strengthened its leadership in the Andean region through a strategy anchored in digital transformation and innovation, talent development, and the integration of sustainability into the core of its business. The company has transitioned into an integrated financial ecosystem—one where the whole is increasingly greater than the sum of its parts—supported by four differentiated growth levers:
1. Prioritizing Leading Market Positions in Underpenetrated Markets with Clear Growth Avenues
Credicorp holds leading positions across mature core businesses in markets that remain structurally underpenetrated. In Peru, low levels of financial inclusion and insurance coverage, together with high informality, continue to create significant room to expand access to financial, payment, insurance, and remittance products and services. This provides a long runway for sustainable growth.
2. Scaling an Integrated Digital Ecosystem
Backed by its innovation portfolio, Credicorp has evolved into an integrated financial ecosystem. The combination of complementary capabilities differentiated distribution channels, and a broad client base allow us to strengthen engagement, accelerate product adoption through cross-selling, and deepen integration across businesses. We will continue to broaden access to financial products and services to advance financial inclusion, with the ambition of incorporating 8 million people into the financial system by 2028.
3. Unlocking Synergies by Leveraging Shared Capabilities Across the Ecosystem
Shared capabilities in technology, data, analytics, artificial intelligence, and risk management constitute a competitive advantage to accelerate value creation at scale. These capabilities strengthen decision-making, enable more personalized customer experiences, generate productivity gains and accelerate innovation, supporting further monetization across the ecosystem.
4. Delivering Strong, Resilient Returns Across Economic Cycles
With decades of disciplined execution, Credicorp has demonstrated its capacity to generate value across economic cycles. The combination of market knowledge and leadership, business diversification, and ecosystem-based competitive advantages strengthen our resilience and supports a sustainable trajectory of profitable growth and long-term value creation.
Main KPIs in Credicorp’s Strategy
| Core Businesses Transformation (1) | Quarter | Up to | |||||||||||||||
| 3Q25 | 2Q26 | 3Q26 | Sep 25 | Sep 26 | |||||||||||||
| Credicorp | |||||||||||||||||
| Innovation Portfolio Risk-Adjusted Revenue Share (2) | 7.4% | 9.9% | 10.7% | 6.3% | 9.9% | ||||||||||||
| Total loan disbursements for MSMEs (S/ million) | 11,812 | 9,419 | 14,682 | 23,471 | 28,692 | ||||||||||||
| Disbursements of sustainable financings (USD million) | 2,130 | 1,861 | 2,602 | 4,077 | 5,197 | ||||||||||||
| BCP Stand-alone | |||||||||||||||||
| Active lending clients (millions) (3) | 2.8 | 4.1 | 4.3 | 2.8 | 4.3 | ||||||||||||
| Consumer NPS | n.a. | 55 | 52 | n.a. | 52 | ||||||||||||
| Cashless transactions (4) | 65% | 69% | 68% | 65% | 68% | ||||||||||||
| Mibanco | |||||||||||||||||
| Share of Low-Cost Deposits / Total Funding (5) | 6.0% | 6.3% | 6.2% | 6.0% | 6.2% | ||||||||||||
| Share of Other Income / Total Risk-Adjusted Revenue | 6.8% | 8.2% | 8.7% | 6.8% | 8.1% | ||||||||||||
| Pacifico | |||||||||||||||||
| Insured Clients (millions) (6) | n.a. | 7.3 | 7.4 | n.a. | 7.4 | ||||||||||||
| Digital Policies (thousands) (7) | 582 | 575 | 576 | 1,884 | 1,884 | ||||||||||||
(1)Management figures, may differ from previously reported. Figures for September 2025, June 2026, and September 2026.
(2)As a percentage of Credicorpʼs total Risk-Adjusted Revenue.
(3)Consumer clients with an outstanding loan. Source: SBS.
(4)Amount transacted through Mobile Banking, Internet Banking, Yape y POS/Total amount transacted through Retail Banking.
(5)Includes low-cost funding products (Ahorro Negocio, Ahorro, Cuenta Premio, and Demand Deposits) as a proportion of total funding
(6)Includes natural and legal clients. New methodological adjustments since 4Q25, related to customers with loan life insurance.
(7)Number of insurance policies issued through digital channels.
13
| | | Earnings Release 3Q / 2026 | Analysis of 3Q26 Consolidated Results | ||||||||
Credicorp’s Strategy Update | |||||||||||
Innovation Portfolio
Credicorp’s innovation portfolio complements and expands the Group’s core businesses through scalable digital platforms and a disciplined investment strategy to create value. This portfolio diversifies revenue streams; broadens our value proposition; and establishes new avenues for growth by leveraging the ecosystem’s capacities and competitive advantages.
The portfolio invests in verticals with high potential for growth, including Neobanking, Services for SME-Pymes, Acquiring, InsurTech, WealthTech and Health, where we drive initiatives in different stages of maturity. The Innovation Committees governs the portfolio through a formal process to evaluate and prioritize initiatives with differentiated value propositions. These initiatives seek to generate relevant changes in the business model and/or present significant potential to generate exponential growth. This framework allows us to allot capital dynamically; conduct follow-up with defined milestones; and re-allot resources to opportunities with higher potential to create value. The initiatives advance through five stages of development: origination, incubation, product-market fit, acceleration and scaling. Once operating maturity is achieved, initiatives can graduate and integrate in the Group’s core businesses.
Initiatives can incubate within core businesses or be channeled through Krealo, our Corporate Venture Capital arm, which establishes outside-in innovation through strategic investments and acquisitions that strengthen and expand current and future lines of business. The portfolio is managed with explicit financial appetites, which consider an impact on ROE of 150 bps and 350 bps on the efficiency ratio. Additionally, in 3Q26, we reached our ambition of representing 10% of the Group’s risk-adjusted income.
Neobanking
Within the innovation portfolio, we created a Neobanking unit that integrates Yape, Yape Bolivia, Tenpo and iO under a common operating model. The value hypothesis behind this unit entails accelerating efforts to build a more integrated digital system by capturing shared capacities, products and data to capture efficiencies; develop synergies; and scale the value proposition over time in the most disciplined manner possible. Neobanking brings together scalable digital platforms with high potential for financial inclusion, monetization and regional expansion, which strengthens the Group’s long-term growth thesis.
1. Yape: scaling profitability with a larger contribution from loans and the ecosystem
Main Management Indicators
| Management KPI's (1) | Quarter | Change % | Up to | Change % | ||||||||||||||||||||||
| 3Q25 | 2Q26 | 3Q26 | QoQ | YoY | Sep 25 | Sep 26 | Sep 26 / Sep 25 | |||||||||||||||||||
| Users | ||||||||||||||||||||||||||
| Users (millions) | 18.7 | 19.8 | 20.0 | 0.9% | 6.7% | 18.7 | 20.0 | 6.7% | ||||||||||||||||||
| Monthly Active Users (MAU) (millions) (2) | 15.5 | 16.7 | 17.0 | 2.1% | 9.8% | 15.5 | 17.0 | 9.8% | ||||||||||||||||||
| Revenue Generating MAU (millions) | 13.2 | 14.6 | 14.9 | 1.9% | 12.8% | 13.2 | 14.9 | 12.8% | ||||||||||||||||||
| Engagement | ||||||||||||||||||||||||||
| # Transactions (millions) | 2,640 | 3,381 | 3,568 | 5.5% | 35.1% | 7,050 | 9,955 | 41.2% | ||||||||||||||||||
| # Revenue Generating Transactions (millions) | 283 | 364 | 395 | 8.3% | 39.2% | 769 | 1,096 | 42.5% | ||||||||||||||||||
| # Transactions / MAU | 58 | 69 | 71 | 3.6% | 21.4% | 58 | 71 | 21.4% | ||||||||||||||||||
| # Average Functionalities / MAU | 2.7 | 2.9 | 2.9 | —% | 7.4% | 2.7 | 2.9 | 7.4% | ||||||||||||||||||
| Experience | ||||||||||||||||||||||||||
| NPS (3) | 76 | 78 | 77 | -1 p | 1 p | 76 | 77 | 1 p | ||||||||||||||||||
| Unit Economics | ||||||||||||||||||||||||||
| Monthly Indicators (4) | ||||||||||||||||||||||||||
| Revenues / MAU (S/) | 7.4 | 11.1 | 11.9 | 7.0% | 60.6% | 7.4 | 11.9 | 60.6% | ||||||||||||||||||
| Expenses / MAU (S/) | -5.0 | -6.0 | -6.1 | 1.5% | 20.9% | -5.0 | -6.1 | 20.9% | ||||||||||||||||||
| Quarterly Indicators (5) | ||||||||||||||||||||||||||
| Revenues / MAU (S/) | 7.4 | 10.7 | 12.0 | 11.8% | 61.5% | 6.5 | 10.8 | 67.0% | ||||||||||||||||||
| Expenses / MAU (S/) | -4.8 | -5.9 | -6.0 | 3.1% | 26.1% | -4.5 | -5.8 | 27.8% | ||||||||||||||||||
| Drivers Monetization | ||||||||||||||||||||||||||
| Total TPV (S/, billions) (6) | 113.9 | 139.7 | 148.5 | 6.3% | 30.4% | 308.8 | 418.0 | 35.3% | ||||||||||||||||||
| Total Revenue Generating TPV (S/, billions) (6) | 12.8 | 18.1 | 18.2 | 0.5% | 42.0% | 33.1 | 52.8 | 59.5% | ||||||||||||||||||
| Payments | ||||||||||||||||||||||||||
| # Bill Payments transactions (millions) | 56 | 72 | 78 | 8.3% | 39.1% | 151 | 217 | 43.7% | ||||||||||||||||||
| Financials | ||||||||||||||||||||||||||
| # Loans Disbursements (thousands) | 4,196 | 6,376 | 6,682 | 4.8% | 59.3% | 11,151 | 18,792 | 68.5% | ||||||||||||||||||
| E-Commerce | ||||||||||||||||||||||||||
| GMV (S/, millions) (7) | 174.1 | 167.2 | 173.2 | 3.6% | -0.5% | 426.1 | 516.1 | 21.1% | ||||||||||||||||||
(1)Management Figures.
14
| | | Earnings Release 3Q / 2026 | Analysis of 3Q26 Consolidated Results | ||||||||
Credicorp’s Strategy Update | |||||||||||
(2)Yape users that have made at least one outgoing transaction in the measurement month.
(3)Net Promoter Score.
(4)Monthly indicators consider the results of the last month of the quarter for the numerator and denominator.
(5)Quarterly indicators are calculated using the sum of the three months in the period for numerator accounts, and the average of the denominator—based on last month’s data from both the current and previous quarters.
(6)Total Payment Volume.
(7)Gross Merchant Volume, includes the following functionalities: Yape Promos, Yape Store, Ticketing, Gaming, Delivery, Buses, Gas, Brand Solutions and Insurance.
Main Financial Results
| Financial Metrics (1) S/ millions | Quarter | Change % | Up to | Change % | ||||||||||||||||||||||
| Sep 25 | Jun 26 | Sep 26 | QoQ | YoY | Sep 25 | Sep 26 | Sep 26 / Sep 25 | |||||||||||||||||||
| Loans (quarter-end balances) | 584.5 | 1,817.0 | 2,313.0 | 27.3% | 295.7% | 584.5 | 2,313.0 | 295.7% | ||||||||||||||||||
| Risk-Adjusted Net Interest Income (2) | 146.4 | 276.1 | 323.0 | 17.0% | 120.6% | 363.3 | 835.0 | 129.8% | ||||||||||||||||||
| Other Income (3) | 195.2 | 256.9 | 282.7 | 10.1% | 44.9% | 495.8 | 775.0 | 56.3% | ||||||||||||||||||
| Total Risk-Adjusted Revenues | 341.6 | 533.0 | 605.7 | 13.6% | 77.3% | 859.1 | 1,610.0 | 87.4% | ||||||||||||||||||
| Total Operating Expenses | -220.1 | -290.9 | -306.4 | 5.3% | 39.2% | -596.9 | -862.1 | 44.4% | ||||||||||||||||||
(1)Management figures.
(2)Includes interest income, interest expense and net provisions.
(3)Includes Other Income recorded in BCP and in Yape Market.
Scale and engagement strengthen Yape’s relevance in the day-to-day
Yape has consolidated its role as a platform for daily use with 17.0 million MAU at the end of 3Q26. Growth is increasingly fueled by deeper relations with users: transactions increased 35.1% YoY, outpacing the pace of growth of MAU (+9.8% YoY) by three-fold with solid feature adoption and satisfaction levels.
This recurrence is the base of this model: each interaction generates data on users’ habits and needs, which improves knowledge of the client and risk assessment while broadening financial product offerings. The opportunity remains significant: revenue-generating transactions per MAU increased to 7.7 (vs 6.2 in 3Q25), while credit penetration (MAUs with an active loan) continued to expand, reaching 18.7% (vs 9.9% in 3Q25).
Growing monetization and operating leverage
In 3Q26, monetization continues to strengthen, where growth in revenues (77.3% YoY) outpaced the increase reported for expenses (39.2% YoY), elevating operating leverage. The uptick in transactionality and in the contribution of loans lifted monthly revenue per MAU to nearly twice the level of monthly expenses per MAU (stable at ~S/6 over the past four quarters), while the proportion of revenue generating MAUs increased to 88% (vs 85% in 3Q25). This evolution strengthened our capacity to transform scale and recurrence into profitability, leading us to post a contribution of 9.8% to Credicorp’s risk-adjusted revenues (vs 6.4% in 3Q25).
Payments are the key driver of activation and client knowledge
In 3Q26, the Payments business represented 44% of Yape’s revenues. Growth was driven mainly by Bill, QR/POS and Checkout Payments, while emerging use cases such as remittances continued to gain traction and delivered strong growth. In Bill Payments, the number of transactions rose 39.1%, driven by higher average ticket sizes and stronger adoption across specific categories, such as education. In QR/POS and Checkout Payments, the transactions level increased on the back of seasonal factors and sports events.
6.4% | 7.2% | 8.0% | 8.9% | 9.8% | |||||||||||||||||||||||||
15
| | | Earnings Release 3Q / 2026 | Analysis of 3Q26 Consolidated Results | ||||||||
Credicorp’s Strategy Update | |||||||||||
Interoperability continues to expand use cases and facilitate the shift from cash to digital payments. Going forward, this dynamic will be complemented by TAPP, which is expected to be implemented starting in 2027, further expanding opportunities for Yape within the payments ecosystem. In this context, Yape will seek to leverage the depth of its user relationships, the quality of its experience, and the frequency of user engagement.
Loans accelerate financial inclusion with a scalable digital proposition
In 3Q26, the financial business, comprising of Floating and Lending, represented 53% of Yape’s total revenues. Within this business, Lending continued to lead growth and accounted for 31% of Yape’s revenues at quarter-end (vs 20% in 3Q25).
As of 3Q26, the loan portfolio reached nearly four times the balance recorded in 3Q25, while the cumulative number of borrowers who have received at least one loan reached 6.3 million (vs. 3.5 million in 3Q25). Portfolio growth was concentrated in Multicuota and SME loans, which together account for nearly ~80% of the portfolio. This evolution reflects the growing share of larger-ticket and longer-tenure loans, while Single-installment loans continues to serve as an entry product that enables Yape to assess customers’ repayment behavior and progressively deepen the lending relationship.
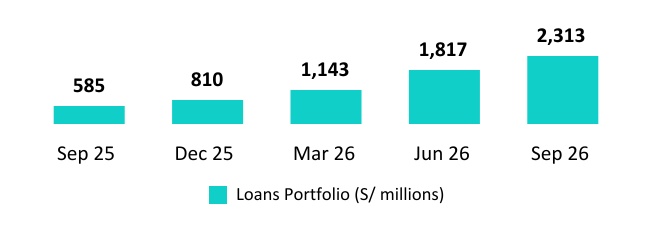
Average tickets and loan terms are: (i) Mono: ~S/230 and 1 month; (ii) Multi: ~S/900 and 10 months; and (iii) SME-Pyme: ~S/3,100 and 10 months.
Growing contribution and strategic relevance for Credicorp
Yape continued to contribute value to Credicorp’s ecosystem by leveraging its scale, recurrence of use and client knowledge. Through its transversal distribution platform, Yape has strengthened cross-selling capacities; extended the Group’s reach to new segments; and accelerated adoption of financial products and services. This advance has consolidated Yape’s role as one of the main drivers of long-term growth, supported by its capacity to scale product distribution and services within the ecosystem.
2. Yape Bolivia: leader in QR transactions in the Financial System
Main management indicators
| Management KPI's (1) | Quarter | Change % | Up to | Change % | ||||||||||||||||||||||
| 3Q25 | 2Q26 | 3Q26 | QoQ | YoY | Sep 25 | Sep 26 | Sep 26 / Sep 25 | |||||||||||||||||||
| Users | ||||||||||||||||||||||||||
| Users (millions) | 3.5 | 4.5 | 4.8 | 7.1% | 36.5% | 3.5 | 4.8 | 36.5% | ||||||||||||||||||
| Monthly Active Users (MAU) (millions) (2) | 1.7 | 2.3 | 2.5 | 8.8% | 43.5% | 1.7 | 2.5 | 43.5% | ||||||||||||||||||
| Engagement | ||||||||||||||||||||||||||
| # Transactions (millions) | 197.9 | 337.7 | 399.0 | 18.2% | 101.6% | 482.6 | 1,009.4 | 109.2% | ||||||||||||||||||
| # Transactions / MAU | 39.6 | 50.3 | 54.1 | 7.6% | 36.6% | 35.7 | 49.5 | 38.5% | ||||||||||||||||||
| Experience | ||||||||||||||||||||||||||
| NPS (3) | 59 | 67 | 61 | -6 p | 1 p | 59 | 61 | 1 p | ||||||||||||||||||
(1) Management figures.
(2) Yape users that have made at least one outgoing transaction in the measurement month.
(3) Net Promoter Score
Yape Bolivia represents one of the first tests of Yape’s regional scalability. It leverages BCP Bolivia’s capacities to modernize daily payments and expand financial inclusion in a market with significant opportunities for digitalization. As of 3Q26, Yape reached 4.8 million users, representing approximately 67% of Bolivia’s economically active population (EAP), with MAUs accounting for 52% of total users (vs. 49% in 3Q25). Yape Bolivia led the QR transactions market with a share of 26.5% (vs 24.7% in 3Q25). These results, which indicate accelerated adoption, consolidate Yape’s role as a relevant actor in the digital payments markets and are proof that the model can be replicated in markets with high levels of informality and intensive use of cash.
16
| | | Earnings Release 3Q / 2026 | Analysis of 3Q26 Consolidated Results | ||||||||
01 Loan Portfolio
Executive Summary
•Total loans expanded 4.2% QoQ and 14.8% YoY. If we exclude the exchange rate effect, total loans increased 4.0% QoQ and 15.2% YoY.
•QoQ, loan growth was driven primarily by (i) an increase in Consumer and SME-Pyme loans at BCP, which was in line with commercial strategies; (ii) an uptick in loans in Wholesale Banking, mainly for short-term loans; and (iii) loan expansion at Mibanco, where the disbursed amount hit a record high in September.
•YoY, total loans increased 15.2% with a neutral exchange rate, fueled primarily by: (i) growth in most segments of Retail Banking at BCP, which was led by Consumer and SME-Pyme; (ii) expansion in wholesale at BCP for both short and long-term loans and; (iii) solid growth at Mibanco thanks to good commercial performance, which was anchored in disciplined strategies for pricing and risk management.
Loan Evolution in Quarter-end balances
This quarter, total loans in quarter-end balances increased 4.2% and 14.8%, QoQ and YoY respectively. If we exclude the exchange rate effect, loans in quarter-end balances rose 4.0% QoQ and 15.2% YoY.
| Total Loans | As of | % Change | USD/PEN Neutral Volume Change | USD/PEN Neutral % Change | |||||||||||||||||||||||||
| (S/ millions) | Sep 25 | Jun 26 | Sep 26 | QoQ | YoY | QoQ | YoY | QoQ | YoY | ||||||||||||||||||||
| BCP Stand-alone | 123,089 | 134,207 | 141,044 | 5.1% | 14.6% | 6,527 | 18,454 | 4.9% | 15.0% | ||||||||||||||||||||
| Mibanco | 13,096 | 14,698 | 15,544 | 5.8% | 18.7% | 846 | 2,448 | 5.8% | 18.7% | ||||||||||||||||||||
| Mibanco Colombia | 2,158 | 2,951 | 3,340 | 13.2% | 54.7% | 366 | 1,217 | 12.4% | 56.4% | ||||||||||||||||||||
| BCP Bolivia | 5,505 | 6,584 | 5,368 | -18.5% | -2.5% | -1,252 | -80 | -19.0% | -1.4% | ||||||||||||||||||||
| ASB Bank Corp. | 1,422 | 1,428 | 1,607 | 12.5% | 13.0% | 168 | 202 | 11.7% | 14.2% | ||||||||||||||||||||
| Others(1) | -519 | -434 | -742 | 71.0% | 43.0% | -311 | -218 | 71.7% | 42.1% | ||||||||||||||||||||
| Total Loans | 144,752 | 159,434 | 166,161 | 4.2% | 14.8% | 6,344 | 22,024 | 4.0% | 15.2% | ||||||||||||||||||||
(1)Includes eliminations for intercompany transactions.
QoQ, the upward trajectory of loans with a neutral exchange rate was spurred mainly by the evolution at BCP Stand-alone (+4.9%), and to a lesser extent at Mibanco (+5.8%) and Mibanco Colombia (+12.4%); the combined impact of these prints was partially offset by a decline in the quarter-end balance at BCP Bolivia (-19.0%). At Mibanco, the disbursed amount hit a record high in September. At Mibanco Colombia, loan growth remained solid, where disbursement rates ticked up and we remained focused on maintaining healthy levels of risk.
YoY, the evolution of loans with a neutral exchange rate was driven mainly by the prints at BCP Stand-alone (+15.0%), followed by Mibanco (+18.7%) and Mibanco Colombia (+56.4%); loans at BCP Bolivia, in contrast, contracted (-1.4%). At Mibanco, the evolution reflected strong commercial performance and was fueled by a strategy to grow in small tickets by leveraging pricing and risk management. At Mibanco Colombia, the upward trajectory of loans was driven by the same factors that drove the QoQ print.
Next, we will analyze the dynamics by segment at BCP Stand-alone:
17
| | | Earnings Release 3Q / 2026 | Analysis of 3Q26 Consolidated Results | ||||||||
01. Loan Portfolio | |||||||||||
QoQ: Total Loans by Segment at BCP Stand-Alone (in Quarter-end Balances)
| Total Loans | As of | QoQ Change | Balance in USD/PEN Neutral As of | QoQ Change in USD/PEN Neutral | ||||||||||||||||||||||
| (S/ millions) | Jun 26 | Sep 26 | Volume | % | Jun 26 | Sep 26 | Volume | % | ||||||||||||||||||
| BCP Stand-alone | 134,207 | 141,044 | 6,838 | 5.1% | 134,207 | 140,734 | 6,527 | 4.9% | ||||||||||||||||||
| Wholesale Banking | 58,148 | 59,372 | 1,224 | 2.1% | 58,148 | 59,140 | 992 | 1.7% | ||||||||||||||||||
| Corporate | 33,545 | 34,416 | 872 | 2.6% | 33,545 | 34,280 | 735 | 2.2% | ||||||||||||||||||
| Middle - Market | 24,603 | 24,956 | 353 | 1.4% | 24,603 | 24,860 | 257 | 1.0% | ||||||||||||||||||
| Retail Banking | 74,081 | 78,354 | 4,272 | 5.8% | 74,081 | 78,294 | 4,213 | 5.7% | ||||||||||||||||||
| SME - Business | 7,440 | 7,821 | 382 | 5.1% | 7,440 | 7,798 | 358 | 4.8% | ||||||||||||||||||
| SME - Pyme | 18,244 | 19,361 | 1,118 | 6.1% | 18,244 | 19,360 | 1,117 | 6.1% | ||||||||||||||||||
| Mortgage | 24,998 | 25,766 | 768 | 3.1% | 24,998 | 25,755 | 758 | 3.0% | ||||||||||||||||||
| Consumer | 16,543 | 18,310 | 1,767 | 10.7% | 16,543 | 18,293 | 1,750 | 10.6% | ||||||||||||||||||
| Credit Card | 6,857 | 7,095 | 237 | 3.5% | 6,857 | 7,087 | 230 | 3.4% | ||||||||||||||||||
Others(1) | 1,978 | 3,318 | 1,341 | 67.8% | 1,978 | 3,301 | 1,323 | 66.9% | ||||||||||||||||||
For consolidation purposes. Loans generated in Foreign Currency (FC) are converted into Local Currency (LC). | ____ | Larger contraction in volume | ||||||
(1)Includes other assets and accruals. | ____ | Larger expansion in volume | ||||||
QoQ, total loans in quarter-end balances at BCP Stand-alone rose 4.9% with a Neutral exchange rate. This growth was led mainly by Retail Banking (+5.7%), followed by Wholesale Banking (+1.7%). In Retail Banking, the uptick was driven by Individuals and SME-Pyme, with noteworthy contributions from:
•Consumer, which registered significant growth in personal loans in 3Q26 after a commercial strategy effectively targeted segments with potential growth
•SME-Pyme, which reported an increase in disbursements of working capital loans, mainly through pilot programs and Yape loans for small businesses.
In Wholesale Banking, loan expansion was fueled primarily by Corporate Banking (+2.2%) and to a lesser extent by Middle Market Banking (+1.0%), where growth was driven mainly by an uptick in short-term loans. Medium and long-term loans also contributed to Wholesale Banking, albeit to a lesser extent, due to a favorable macroeconomic environment.
YoY: Total Loans by Segment at BCP Stand-Alone (in Quarter-end balances)
| Total Loans | As of | YoY Change | Balance in USD/PEN Neutral As of | YoY Change in USD/PEN Neutral | ||||||||||||||||||||||
| (S/ millions) | Sep 25 | Sep 26 | Volume | % | Sep 25 | Sep 26 | Volume | % | ||||||||||||||||||
| BCP Stand-alone | 123,089 | 141,044 | 17,955 | 14.6% | 123,089 | 141,544 | 18,454 | 15.0% | ||||||||||||||||||
| Wholesale Banking | 53,340 | 59,372 | 6,032 | 11.3% | 53,340 | 59,747 | 6,407 | 12.0% | ||||||||||||||||||
| Corporate | 31,485 | 34,416 | 2,932 | 9.3% | 31,485 | 34,637 | 3,152 | 10.0% | ||||||||||||||||||
| Middle - Market | 21,855 | 24,956 | 3,101 | 14.2% | 21,855 | 25,111 | 3,255 | 14.9% | ||||||||||||||||||
| Retail Banking | 67,958 | 78,354 | 10,395 | 15.3% | 67,958 | 78,449 | 10,491 | 15.4% | ||||||||||||||||||
| SME - Business | 8,097 | 7,821 | -275 | -3.4% | 8,097 | 7,859 | -238 | -2.9% | ||||||||||||||||||
| SME - Pyme | 16,447 | 19,361 | 2,915 | 17.7% | 16,447 | 19,363 | 2,916 | 17.7% | ||||||||||||||||||
| Mortgage | 23,377 | 25,766 | 2,389 | 10.2% | 23,377 | 25,784 | 2,406 | 10.3% | ||||||||||||||||||
| Consumer | 13,781 | 18,310 | 4,529 | 32.9% | 13,781 | 18,337 | 4,556 | 33.1% | ||||||||||||||||||
| Credit Card | 6,257 | 7,095 | 838 | 13.4% | 6,257 | 7,107 | 850 | 13.6% | ||||||||||||||||||
| Others(1) | 1,791 | 3,318 | 1,527 | 85.3% | 1,791 | 3,347 | 1,556 | 86.9% | ||||||||||||||||||
For consolidation purposes. Loans generated in Foreign Currency (FC) are converted into Local Currency (LC). | ____ | Larger contraction in volume | ||||||
(1)Includes other assets and accruals. | ____ | Larger expansion in volume | ||||||
18
| | | Earnings Release 3Q / 2026 | Analysis of 3Q26 Consolidated Results | ||||||||
01. Loan Portfolio | |||||||||||
YoY, total loans in quarter-end balances at BCP Stand-alone increased 15.0% with a Neutral exchange rate. This growth was driven mainly by Retail Banking (+15.4%), followed by Wholesale Banking (+12.0%). In Retail Banking, most segments reported expansion. Consumer (+33.1%) and SME-Pyme (+17.7%) led growth, which was fueled by the same factors in play QoQ and by an uptick in economic activity. The increase registered in Mortgage (+10.3%) was primarily attributable to operating improvements, which reduced origination times, and secondarily to a rebound in the underlying demand for this product.
In Wholesale Banking, growth was fueled mainly by Middle Market Banking (+14.9%) and Corporate Banking (+10.0%). Both the Middle Market and Corporate segments have benefited from stronger economic activity.
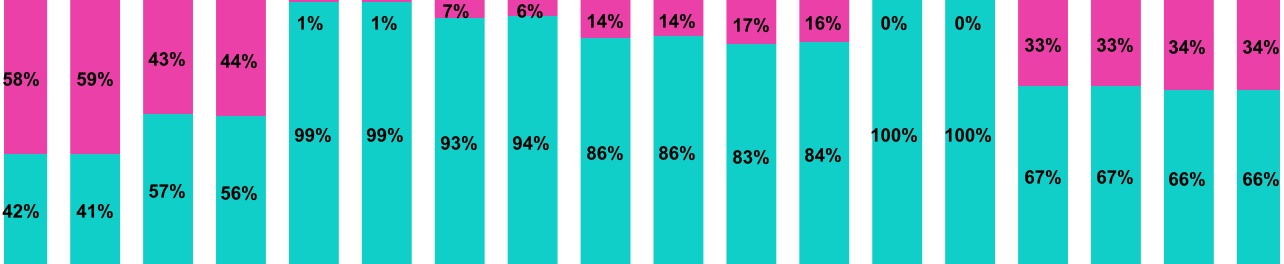
YoY evolution of Loan Dollarization (in Quarter-end balances)
FC Total Portfolio Participation
-Credicorp: 34.4% in Sep 26 and 34.2% in Sep 25
-BCP Stand-alone: 32.8% in Sep 26 and 32.8% in Sep 25
| 35.7% | 4.7% | 11.7% | 15.5% | 11.0% | 4.3% | 9.4% | 84.9% | ||||||||||||||||||||||||||||||||||||||||||||||||||||||||||||||||||||||||||||||||||||||||||||||||||||
| of total loans | of total loans | of total loans | of total loans | of total loans | of total loans | of total loans | of total loans | ||||||||||||||||||||||||||||||||||||||||||||||||||||||||||||||||||||||||||||||||||||||||||||||||||||
| Sep 25 | Sep 26 | Sep 25 | Sep 26 | Sep 25 | Sep 26 | Sep 25 | Sep 26 | Sep 25 | Sep 26 | Sep 25 | Sep 26 | Sep 25 | Sep 26 | Sep 25 | Sep 26 | Sep 25 | Sep 26 | ||||||||||||||||||||||||||||||||||||||||||||||||||||||||||||||||||||||||||||||||||||||||||
| BCP Wholesale Banking | BCP SME-Business | BCP SME-Pyme | BCP Mortgage | BCP Consumer | BCP Credit Cards | Mibanco | BCP Stand-alone | Credicorp (1) | |||||||||||||||||||||||||||||||||||||||||||||||||||||||||||||||||||||||||||||||||||||||||||||||||||
| ____ | LC | ____ | FC | ||||||||||||||||||||||||||||||||||||||||||||||||||||||||||||||||||||||||||||||||||||||||||||||||||||||||
(1)Participation in FC loans at the Credicorp level considers BCP Stand-alone, Mibanco, Mibanco Colombia, BCP Bolivia and ASB
YoY, the dollarization level of total loans rose 15 bps. This evolution was propelled by growth in FC loans (+15.3%), mainly in Wholesale Banking, and was offset by growth in LC loans (+14.5%), which was fueled primarily by the SME-Pyme and Consumer segments.
Loan Evolution in Average Daily Balances
Total loans in average daily balances (ADB) rose 1.7% and 9.4%, QoQ and YoY, respectively. It is important to note that the figures for loans are derived from internal management balances.
For more details on loan dynamics in ADB, see Annex 12.1.
19
| | | Earnings Release 3Q / 2026 | Analysis of 3Q26 Consolidated Results | ||||||||
02 | Deposits | ||||
Executive Summary
•Total deposits slightly declined QoQ and increased 14.3% YoY.
•QoQ, the decline was mainly driven by the normalization of wholesale deposit balances at BCP Stand-alone, which partially shifted toward Time Deposits. Higher Savings Deposits, supported by inflows from the July statutory bonus, also partially offset the decline.
•YoY, growth was spurred by an increase in Savings Deposits and Demand Deposits, which was driven by fund inflows from pension withdrawals.
•Growth over both periods was attributable to our ongoing efforts to strengthen our transactional offerings. It is also important to mention that at the end of 3Q26, 73.19% of Total deposits were Low-Cost (Demand + Savings).
| Deposits | As of | Change (%) | USD/PEN Neutral % Change | ||||||||||||||||||||
| S/ 000 | Sep 25 | Jun 26 | Sep 26 | QoQ | YoY | QoQ | YoY | ||||||||||||||||
| Demand deposits | 50,930,173 | 64,854,351 | 60,663,873 | -6.5% | 19.1% | -6.8% | 19.8% | ||||||||||||||||
| Saving deposits | 60,580,840 | 70,661,922 | 71,832,209 | 1.7% | 18.6% | 1.4% | 19.0% | ||||||||||||||||
| Time deposits | 43,115,987 | 42,306,886 | 44,573,397 | 5.4% | 3.4% | 5.1% | 3.9% | ||||||||||||||||
| Severance indemnity deposits | 2,956,446 | 3,415,387 | 3,112,570 | -8.9% | 5.3% | -9.0% | 5.5% | ||||||||||||||||
| Interest payable | 847,009 | 882,220 | 836,808 | -5.1% | -1.2% | -5.6% | -0.5% | ||||||||||||||||
| Low-cost deposits (1) | 111,511,013 | 135,516,273 | 132,496,082 | -2.2% | 18.8% | -2.5% | 19.4% | ||||||||||||||||
| Total Deposits | 158,430,455 | 182,120,766 | 181,018,857 | -0.6% | 14.3% | -0.9% | 14.8% | ||||||||||||||||
(1)Includes Demand Deposits and Saving Deposits
QoQ, our balance for Total Deposits fell 0.6%. This result was mainly fueled by:
•A 6.5% reduction in the balance for Demand Deposits. This evolution was mainly driven by a drop in FC volumes at BCP Stand-alone, which was triggered mainly by the normalization of wholesale deposit balances at BCP Stand-alone, which partially shifted toward Time Deposits.
The drop in Demand Deposits was partially offset by:
•Time Deposits, which were up 5.4%. This evolution was driven mainly by an uptick in captures of wholesale clients in the LC portfolio at BCP Stand-alone, which was in line with our funding strategy, and secondarily by fund migration from Demand Deposits, as previously explained.
•Savings deposits, which rose 1.7% on the back of growth in LC balances in Individuals after statutory bonuses were paid in July. This uptick attests to the strength of our transactional offering, which has allowed us to continue capturing deposits in a high-liquidity environment.
YoY, our balance for Total Deposits rose 14.3%. This evolution was fueled mainly by:
•Growth of 18.6% in Savings Deposits and 19.1% in Demand Deposits. The uptick in these Low-cost Deposits was fueled by an increase in LC volumes at BCP Stand-alone, which continued to capture surplus liquidity from the 8th pension fund withdrawal that began in November 2025.
Growth in Low-cost Deposits was thanks to our sustained efforts to strengthen our differentiated transactional offering. These initiatives are supported by investments in digital infrastructure and stronger client relations, both of which have helped us capture deposits in a high-liquidity environment. At the end of September 2026, Low-Cost Deposits represented 73.2% of total deposits, up 281 bps YoY.
20
| | | Earnings Release 3Q / 2026 | Analysis of 3Q26 Consolidated Results | ||||||||
02. Deposits | |||||||||||
Deposit Dollarization Level
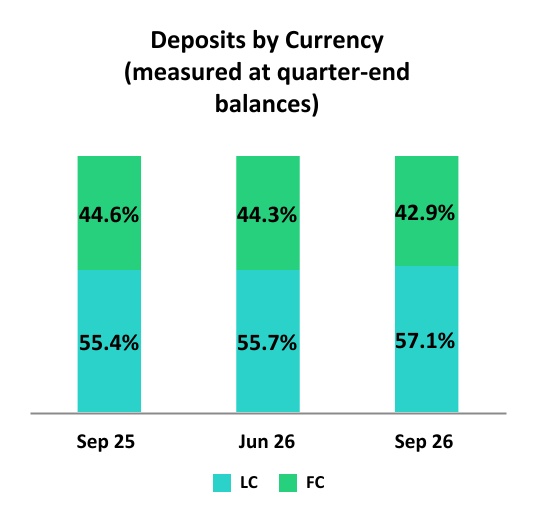
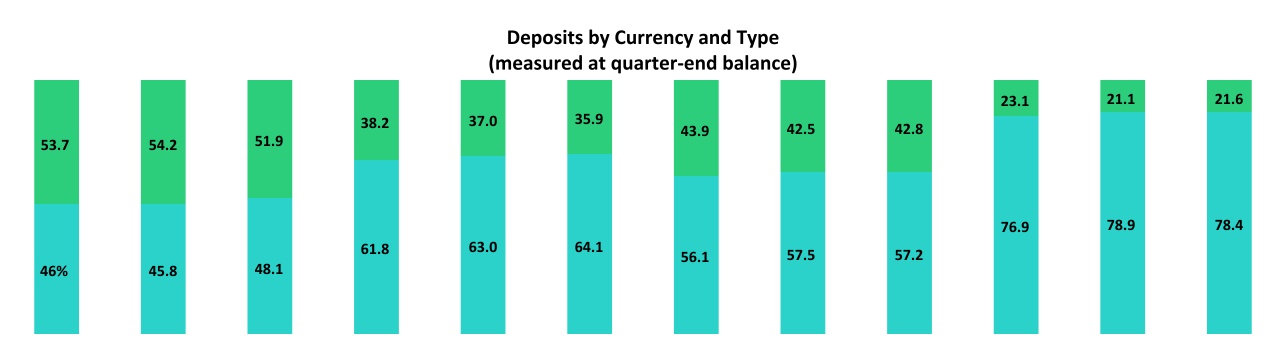
At the end of September 2026, the dollarization level of Total Deposits dropped 145 bps QoQ to stand at 42.9%, which is still below the average for the last 4 years (47.6%). This decline was mainly driven by higher Savings Deposits, supported by increased liquidity from July bonus payments, as well as lower FC Demand Deposits from wholesale clients, partially offset by an increase in FC Time Deposits.
YoY, the dollarization level declined 178 bps. This evolution was fueled mainly by an uptick in liquidity in LC from Individuals, which was associated with inflows from pension fund withdrawals, and LC funds from SMEs, supported by higher business activity.
| Sep 25 | Jun 26 | Sep 26 | Sep 25 | Jun 26 | Sep 26 | Sep 25 | Jun 26 | Sep 26 | Sep 25 | Jun 26 | Sep 26 | |||||||||||||||||||||||||||||||||||||||||||||||||||||||||||||||||||||
| Demand | Savings | Time | Severance Indemnity | |||||||||||||||||||||||||||||||||||||||||||||||||||||||||||||||||||||||||||||
| ____ | LC | ____ | FC | |||||||||||||||||||||||||||||||||||||||||||||||||||||||||||||||||||||||||||||
21
| | | Earnings Release 3Q / 2026 | Analysis of 3Q26 Consolidated Results | ||||||||
02. Deposits | |||||||||||
Loan / Deposit Ratio (L/D ratio)
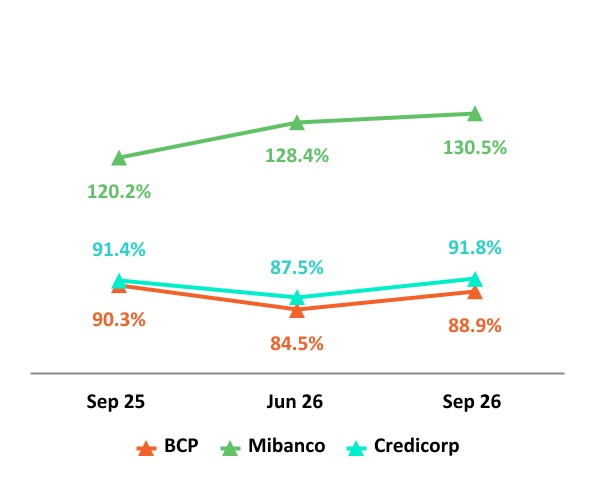
QoQ, the L/D ratio rose 438 bps at BCP Stand-alone, driven by growth in Retail loans, which rose on the back of better prints in both Consumer and SME-Pyme. At Mibanco, the ratio increased 209 bps as loan growth continued to gain traction. This growth was partially offset by an increase in Savings Deposits, which was driven by our efforts to capture higher balances in a context of ample liquidity.
YoY, the L/D ratio fell 143 bps at BCP Stand-alone. This evolution was mainly fueled by growth in Low-cost deposits, which rose on the back of an increase in wholesale and retail deposit captures in a high liquidity environment. At Mibanco the ratio increased 1,035 bps, after loans expanded through the same factors that spurred growth QoQ. The positive evolution of loans was partially offset by an increase in Savings Deposits, which was also triggered by the same factors that drove the uptick seen QoQ.
In this context, the L/D ratio at Credicorp stood at 91.8%.
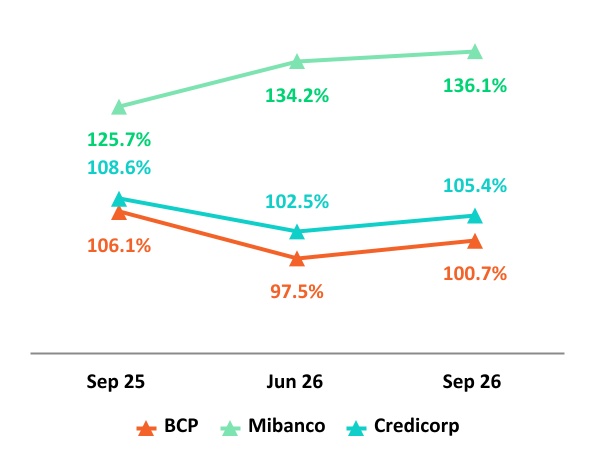
L/D Ratio Local Currency
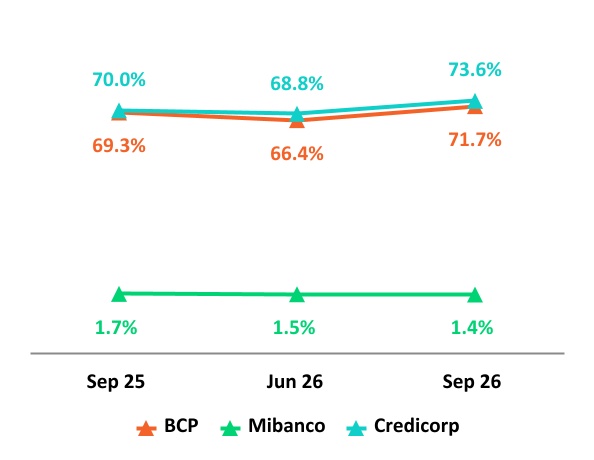
L/D Ratio Foreign Currency
22
| | | Earnings Release 3Q / 2026 | Analysis of 3Q26 Consolidated Results | ||||||||
03 | Interest-Earning Assets (IEA) and Funding | ||||
Executive Summary
•QoQ, IEA remained relatively stable (+0.4%) after expansion in the loan balances at BCP (in both Retail and Wholesale) and Mibanco outstripped the drop registered in the balance for Cash and Due to Banks. Funding fell (-1.6%), driven mainly by a subordinated bond scheduled call at BCP and, to a lesser extent, by a reduction in the balance of BCRP instruments.
•YoY, IEA rose 10.8%, fueled primarily by loan growth in Retail and Wholesale Banking at BCP. The uptick in total investments, which was part of a strategy to capitalize on surplus liquidity, was a secondary driver of growth in IEA. On the Funding side, (+ 11.2% YoY), growth in deposits was the primary driver of expansion and was partially offset by a drop in the balance for BCRP instruments.
3.1. IEA
| Interest Earning Assets | As of | % Change | |||||||||||||||
| S/000 | Sep 25 | Jun 26 | Sep 26 | QoQ | YoY | ||||||||||||
| Cash and due from banks | 35,862,184 | 40,553,153 | 33,981,593 | -16.2% | -5.2% | ||||||||||||
| Total investments | 51,186,579 | 58,430,063 | 58,604,281 | 0.3% | 14.5% | ||||||||||||
| Cash collateral, reverse repurchase agreements and securities borrowing | 3,404,639 | 1,185,971 | 1,888,940 | 59.3% | -44.5% | ||||||||||||
| Total loans | 144,752,254 | 159,434,397 | 166,161,042 | 4.2% | 14.8% | ||||||||||||
| Total interest earning assets | 235,205,656 | 259,603,584 | 260,635,856 | 0.4% | 10.8% | ||||||||||||
QoQ, IEA rose 0.4%. This evolution was fueled mainly by growth in the balance for Total Loans, which increased 4.2% on the back of the dynamics explained in Chapter 1. Loan Portfolio. The increase in the balance for Cash collateral, reverse repurchase agreements and securities borrowing was a secondary driver of IEA expansion over the period. These dynamics were partially offset by a reduction in the balance for Cash and due to banks, which was impacted by movements by Corporate clients at BCP.
YoY, IEA rose 10.8%, spurred primarily by growth in Loans, which was led by BCP Stand-alone (both Retail Banking and Wholesale Banking) and by Mibanco. The uptick in the balance for Total Investments also contributed to IEA expansion, albeit to a lesser extent, under a strategy to capitalize on surplus liquidity. These dynamics were partially offset by a drop in the balances for Cash and due from banks and Cash collateral, reverse repurchase agreements and securities borrowing.
3.2. Funding
| Funding | As of | % Change | |||||||||||||||
| S/000 | Sep 25 | Jun 26 | Sep 26 | QoQ | YoY | ||||||||||||
| Deposits and obligations | 158,430,455 | 182,120,766 | 181,018,857 | -0.6% | 14.3% | ||||||||||||
| Due to banks and correspondents | 11,241,079 | 11,755,256 | 11,260,498 | -4.2% | 0.2% | ||||||||||||
| BCRP instruments | 6,643,892 | 4,043,986 | 3,204,454 | -20.8% | -51.8% | ||||||||||||
| Repurchase agreements with clients and third parties | 3,537,281 | 4,332,500 | 4,877,233 | 12.6% | 37.9% | ||||||||||||
| Bonds and notes issued | 12,209,724 | 14,789,015 | 13,273,001 | -10.3% | 8.7% | ||||||||||||
| Total funding | 192,062,431 | 217,041,523 | 213,634,043 | -1.6% | 11.2% | ||||||||||||
QoQ, Funding dropped -1.6%. This evolution was fueled primarily by a reduction in the balance for Bonds and notes issued, which reflected the scheduled call of a subordinated bond at BCP. The balance for Deposits and obligations remained relatively stable over the period, where the decrease in Low-cost deposits was offset by an increase in Time Deposits.
YoY, Funding rose 11.2%, spurred mainly by growth in the balance for Deposits and obligations, which rose on the back of an uptick in low-cost deposits (through inflows from pension fund withdrawals and greater dynamism in the economy). The increase in the deposit and obligations line was partially offset by a reduction in the balance for BCRP instruments.
23
| | | Earnings Release 3Q / 2026 | Analysis of 3Q26 Consolidated Results | ||||||||
04 | Net Interest Income (NII) | ||||
Executive Summary
•NII increased +6.0% QoQ. This evolution, which was driven mainly by an uptick in interest on loans, accompanied loan growth in Retail Banking at BCP and Mibanco and was partially offset by growth in interest on deposits and interest on due to banks and correspondents.
•YoY, NII rose 17.7%, propelled by a rise in Interest and Similar income, which ticked up through an increase in the loan volume. The rise in Interest and Similar income was partially offset by an increase in Interest and Similar Expenses.
•NIM expanded 36 bps YoY to stand at 6.93%. This growth was driven mainly by an increase in the IEA yield and a drop in the funding cost. Risk-adjusted NIM stood at 5.66% (+13 bps YoY), as margin expansion more than offset the higher cost of risk.
| Net Interest Income / Margin | Quarter | % Change | Up to | % Change | ||||||||||||||||||||||
| S/000 | 3Q25 | 2Q26 | 3Q26 | QoQ | YoY | Sep 25 | Sep 26 | Sep 26 / Sep 25 | ||||||||||||||||||
| Interest and Similar Income | 4,987,693 | 5,413,885 | 5,717,687 | 5.6% | 14.6% | 14,804,775 | 16,343,984 | 10.4% | ||||||||||||||||||
| Interest and Similar Expenses | (1,299,864) | (1,316,934) | (1,376,563) | 4.5% | 5.9% | 3,929,563 | 3,943,182 | 0.3% | ||||||||||||||||||
| Interest Expense (excluding Net Insurance Financial Expenses) | (1,158,420) | (1,147,859) | (1,208,903) | 5.3% | 4.4% | (3,513,442) | (3,443,529) | -2.0% | ||||||||||||||||||
| Net Insurance Financial Expenses | (141,444) | (169,075) | (167,660) | -0.8% | 18.5% | (416,121) | (499,653) | 20.1% | ||||||||||||||||||
| Net Interest, similar income and expenses | 3,687,829 | 4,096,951 | 4,341,124 | 6.0% | 17.7% | 10,875,212 | 12,400,802 | 14.0% | ||||||||||||||||||
| Balances | ||||||||||||||||||||||||||
| Average Interest Earning Assets (IEA) | 233,285,291 | 257,562,678 | 260,119,720 | 1.0% | 11.5% | 237,958,451 | 253,498,885 | 6.5% | ||||||||||||||||||
| Average Funding | 190,658,187 | 213,379,275 | 215,337,783 | 0.9% | 12.9% | 195,494,018 | 208,490,118 | 6.6% | ||||||||||||||||||
| Yields | ||||||||||||||||||||||||||
| Yield on IEAs | 8.55% | 8.41% | 8.79% | 38 bps | 24 bps | 8.30% | 8.60% | 30 bps | ||||||||||||||||||
| Cost of Funds(1) | 2.43% | 2.15% | 2.25% | 10 bps | -18 bps | 2.40% | 2.20% | -20 bps | ||||||||||||||||||
| Net Interest Margin (NIM)(1) | 6.57% | 6.63% | 6.93% | 30 bps | 36 bps | 6.33% | 6.79% | 46 bps | ||||||||||||||||||
| Risk-Adjusted Net Interest Margin(1) | 5.53% | 5.49% | 5.66% | 17 bps | 13 bps | 5.34% | 5.71% | 37 bps | ||||||||||||||||||
| Peru's Reference Rate | 4.25% | 4.25% | 4.25% | 0 bps | 0 bps | 4.25% | 4.25% | 0 bps | ||||||||||||||||||
| FED funds rate | 4.25% | 3.75% | 4.00% | 25 bps | -25 bps | 4.25% | 4.00% | -25 bps | ||||||||||||||||||
(1)For further details on the NIM and Cost of Funds calculation, please refer to Annex 12.8.
QoQ, Net Interest Income (NII) rose 6.0%. This result was driven mainly by growth in Interest and Similar income as Interest on loans ticked up alongside growth in volumes in Retail banking at BCP and at Mibanco. The improvement in Interest and similar income was partially offset by growth in Interest and similar expenses. The aforementioned increase was driven by an uptick in funding costs, which rose alongside an increase in time deposits.
YoY, NII increased 17.7%. This evolution was driven mainly by growth in Interest and Similar Income, which was fueled by the uptick in interest on loans that accompanied a rise in loans volumes at BCP and Mibanco. Interest and similar expenses were up this quarter, which partially offset the increase in Interest and similar income. Growth in the former was due primarily to an uptick in interest expenses, related to an increase in time deposits and secondarily, by higher expenses for interest on bonds and subordinated debt.
YTD, NII rose 14.0%. This result was fueled by an increase in Interest and Similar Income, which was driven by the same dynamics that drove the YoY evolution. Meanwhile, Interest and Similar Expenses remained relatively stable, as the decline in Interest on due to banks and correspondents was offset by higher Net Insurance Financial Expenses.
24
| | | Earnings Release 3Q / 2026 | Analysis of 3Q26 Consolidated Results | ||||||||
04. Net Interest Income (NII) | |||||||||||
Net Interest Margin
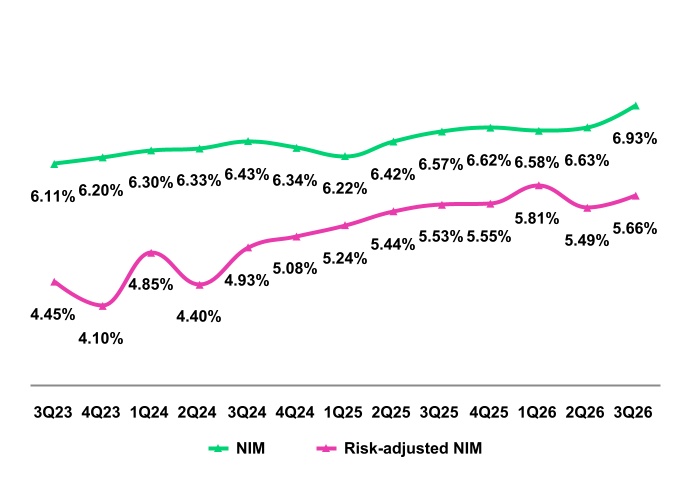
NIM rose (+36 bps YoY) to stand at 6.93% at the end of 3Q26. This expansion was driven mainly by growth in the IEA yield (+24 bps YoY), which increased on the back of an uptick in loans’ share of the IEA mix. The funding cost, which dropped (-18 bps YoY) this quarter due to a rise in low-cost deposits’ share of the mix, also contributed to NIM’s evolution. Risk-adjusted NIM, in turn, stood at 5.66% at the end of 3Q26 (+13 bps YoY), as margin expansion more than offset the higher cost of risk.
Dynamics of the Net Interest Margin by Currency
Interest Income / IEA | 3Q25 | 2Q26 | 3Q26 | ||||||||||||||||||||||||||
S/ millions | Average Balance | Income | Yields | Average Balance | Income | Yields | Average Balance | Income | Yields | ||||||||||||||||||||
| Total (LC + FC) | |||||||||||||||||||||||||||||
Cash and equivalents | 35,034 | 316 | 3.6% | 41,767 | 321 | 3.1% | 37,267 | 271 | 2.9% | ||||||||||||||||||||
Other IEA | 3,999 | 68 | 6.8% | 1,698 | 23 | 5.4% | 1,537 | 23 | 6.0% | ||||||||||||||||||||
Investments | 51,396 | 643 | 5.0% | 57,968 | 699 | 4.8% | 58,517 | 758 | 5.2% | ||||||||||||||||||||
Loans | 142,857 | 3,961 | 11.1% | 156,129 | 4,371 | 11.2% | 162,798 | 4,665 | 11.5% | ||||||||||||||||||||
Total IEA | 233,286 | 4,988 | 8.6% | 257,562 | 5,414 | 8.4% | 260,119 | 5,717 | 8.8% | ||||||||||||||||||||
IEA (LC) | 56.7% | 71.4% | 10.8% | 56.5% | 72.3% | 10.8% | 57.7% | 73.1% | 11.1% | ||||||||||||||||||||
IEA (FC) | 43.3% | 28.6% | 5.7% | 43.5% | 27.7% | 5.3% | 42.3% | 26.9% | 5.6% | ||||||||||||||||||||
| Interest Expense / Funding | 3Q25 | 2Q26 | 3Q26 | ||||||||||||||||||||||||||
| S/ millions | Average Balance | Expense | Yields | Average Balance | Expense | Yields | Average Balance | Expense | Yields | ||||||||||||||||||||
| Total (LC + FC) | |||||||||||||||||||||||||||||
| Deposits | 156,577 | 565 | 1.4% | 180,500 | 566 | 1.3% | 181,570 | 601 | 1.3% | ||||||||||||||||||||
| BCRP + Due to Banks | 17,067 | 253 | 5.9% | 14,175 | 224 | 6.3% | 15,132 | 232 | 6.1% | ||||||||||||||||||||
| Bonds and Notes | 12,161 | 165 | 5.4% | 14,770 | 195 | 5.3% | 14,031 | 193 | 5.5% | ||||||||||||||||||||
| Others | 4,853 | 317 | 26.1% | 3,933 | 332 | 33.8% | 4,605 | 349 | 30.3% | ||||||||||||||||||||
| Total Funding | 190,658 | 1,300 | 2.7% | 213,378 | 1,317 | 2.5% | 215,338 | 1,375 | 2.6% | ||||||||||||||||||||
| Funding (LC) | 52.6% | 52.8% | 2.7% | 53.4% | 52.5% | 2.4% | 53.8% | 52.1% | 2.5% | ||||||||||||||||||||
| Funding (FC) | 47.4% | 47.2% | 2.7% | 46.6% | 47.5% | 2.5% | 46.2% | 47.9% | 2.6% | ||||||||||||||||||||
| NIM(1) | 233,286 | 3,688 | 6.3% | 257,562 | 4,097 | 6.4% | 260,119 | 4,342 | 6.7% | ||||||||||||||||||||
| NIM (LC) | 56.7% | 77.9% | 8.7% | 56.5% | 78.7% | 8.9% | 57.7% | 79.7% | 9.2% | ||||||||||||||||||||
| NIM (FC) | 43.3% | 22.1% | 3.2% | 43.5% | 21.3% | 3.1% | 42.3% | 20.3% | 3.2% | ||||||||||||||||||||
(1)Unlike the NIM figure calculated according to the formula in Appendix 12.8, the NIM presented in this table includes “Financial Expense associated with the insurance and reinsurance activity, net”.
QoQ Analysis
QoQ, Net Interest Income (NII) rose 6.0%. This evolution was driven by growth in NII in LC and, to a lesser extent, in FC. IEA in LC represented 57.7% of total IEA at the end of 3Q26 and accounted for 73.1% of interest income generated this quarter.
Dynamics in Local Currency (LC)
25
| | | Earnings Release 3Q / 2026 | Analysis of 3Q26 Consolidated Results | ||||||||
04. Net Interest Income (NII) | |||||||||||
NII in LC increased 7.4% QoQ. This evolution was driven by an uptick in interest income, which was positively impacted by an increase in interest on loans after loan volumes at BCP and Mibanco rose. Interest expenses, in turn, grew due to an increase in expenses for deposits, which rose on the back of growth in time deposits’ share of the funding mix.
Dynamics in Foreign Currency (FC)
NII in FC increased 0.8% QoQ. This print was driven mainly by (i) an increase in interest on Loans, after the loan volume rose, mainly through Wholesale Banking at BCP and (ii) growth in interest on securities. Interest expenses, in turn, rose this quarter, driven mainly by an increase in expenses for deposits, mainly through Wholesale Banking at BCP.
YoY Analysis
YoY, NII increased 17.7%. This evolution was mainly fueled by growth in NII in LC and to a lesser extent, in FC.
Dynamics in Local Currency (LC)
NII in LC rose 20.5% YoY on the back of an increase in interest income, which was partially offset by an uptick in interest expenses. These results were driven by the following dynamics:
The rise in Interest income was mainly fueled by an uptick in interest on Loans, which rose alongside growth in volumes at BCP and Mibanco. Interest on securities, which increased through a strategy to take advantage of market opportunities, also contributed to this dynamic, albeit to a lesser extent. In this scenario, the IEA yield in LC increased 38 bps to stand at 11.1%.
Interest expenses this quarter rose, impacted by an increase in LC time deposits’ share of the funding mix. An uptick in interest on bonds and subordinated debt was a secondary contributor to growth in expenses this quarter. In this context, the cost of funding in LC dropped 27 bps to stand at 2.5%.
Dynamics in Foreign Currency (FC)
NII in FC rose 8.0% YoY due to the following dynamics:
Interest income rose, driven mainly by growth in interest on Loans, which ticked up alongside an increase in loan volumes in Wholesale Banking at BCP. IEA in FC increased 8.9% over the period. In this context, the IEA yield dropped 7 bps to stand at 5.6%.
Interest expenses in FC increased 7.3%, driven by higher expenses for deposits and to a lesser extent, for interest on bonds and subordinated debt. Total Funding in FC increased 10.0% over the period. In this context, the funding cost in FC dropped 7 bps to stand at 2.6%.
YTD Analysis
YTD, NII increased 14.0%, on the back of growth in both LC and FC.
Dynamics in Local Currency (LC)
NII in LC rose 16.1%. This evolution was driven primarily by an uptick in interest income and secondarily, by a drop in interest expenses. The rise in interest income YTD was fueled mainly by an increase in income from Loans, which rose on the back of the same dynamics seen YoY, while the reduction in expenses was driven mainly by a drop in interest expenses for Due to banks and secondarily, by growth in low-cost deposits’ share of the funding mix.
Dynamics in Foreign Currency (FC)
NII in FC increased 6.7%. This print was fueled mainly by growth in interest income, after income from loans rose on the back of an uptick in loan volumes. Expenses were relatively stable given that the uptick in interest on deposits was offset by a drop in interest on Due to banks.
26
| | | Earnings Release 3Q / 2026 | Analysis of 3Q26 Consolidated Results | ||||||||
05 | Portfolio Quality and Provisions | ||||
Executive Summary
•As of Sep 26, Credicorp’s NPL ratio improved to 3.9%, down -15 bps QoQ and -91 bps YoY. QoQ, loan growth outpaced higher NPLs in BCP Retail Banking and Mibanco, partly offset by lower NPLs in BCP Wholesale Banking. YoY, the improvement reflected loan growth and lower NPLs, mainly at BCP Stand-alone, supported by improved origination, monitoring and collections.
•Provisions rose 13.3% QoQ and 37.4% YoY, which led the Cost of Risk (CoR) to stand at 2.0%. This quarter included additional provisions for El Niño risk, based on a “Very Strong” event as our base scenario, at quarter-end. QoQ, underlying provisions were relatively stable, as higher provisions in BCP Retail and Mibanco were offset by improved performance in BCP Wholesale. YoY, the increase in underlying provisions was mainly driven by a higher share of retail loans in the portfolio mix, while overall portfolio quality remained healthy.
Portfolio indicators continued to evolve positively and transversally across segments. This evolution was supported by enhancements in risk management, as we leverage data, analytics and more sophisticated tools to bolster origination, monitoring and collections.
5.1 Portfolio Quality
Total Portfolio Quality (in quarter-end balances)
| Loan Portfolio quality and Delinquency ratios | As of | % Change | |||||||||||||||
| S/000 | Sep 25 | Jun 26 | Sep 26 | QoQ | YoY | ||||||||||||
| Total loans (Quarter-end balance) | 144,752,254 | 159,434,397 | 166,161,042 | 4.2% | 14.8% | ||||||||||||
| Write-offs | 713,933 | 535,949 | 595,093 | 11.0% | -16.6% | ||||||||||||
| Internal overdue loans (IOLs) | 4,953,303 | 4,504,185 | 4,543,621 | 0.9% | -8.3% | ||||||||||||
| Internal overdue loans over 90-days | 4,142,080 | 3,657,815 | 3,772,023 | 3.1% | -8.9% | ||||||||||||
| Refinanced loans | 2,016,442 | 1,953,602 | 1,936,937 | -0.9% | -3.9% | ||||||||||||
| Non-performing loans (NPLs) | 6,969,745 | 6,457,787 | 6,480,558 | 0.4% | -7.0% | ||||||||||||
| IOL ratio | 3.4% | 2.8% | 2.7% | -10 bps | -69 bps | ||||||||||||
| IOL over 90-days ratio | 2.9% | 2.3% | 2.3% | -2 bps | -59 bps | ||||||||||||
| NPL ratio | 4.8% | 4.1% | 3.9% | -15 bps | -91 bps | ||||||||||||
QoQ, NPL balance increased 0.4%, as overdue loan growth was partially offset by a reduction in the refinanced portfolio. Write-offs rose 11.0%, driven mainly by BCP Stand-alone.
QoQ, the slight increase in the NPL portfolio was driven mainly by Retail at BCP Stand-alone and by Mibanco. At BCP, the uptick was fueled primarily by the SME-PYME and Consumer segments, where the higher-yield segments continued to grow within a controlled risk parameter. At Mibanco, the NPL portfolio rose alongside an increase in the loan volume. The aforementioned was partially offset by a reduction in refinancing in Corporate Banking and a drop in NPLs in Middle Market Banking at BCP Stand-alone.
YoY, the NPL portfolio dropped -7.0% on the back of the evolution at BCP Stand-alone. Write-offs fell -16.6%, positively impacted by an improvement in collections.
YoY, the trends remained positive, backed by a sustained reduction in the NPL portfolio. Performance was driven by BCP Stand-alone, primarily through an uptick in payment performance and the solid evolution of recent vintages in Retail and secondarily, thanks to favorable dynamics in Wholesale. The aforementioned was partially offset by an increase in NPL balances at BCP Bolivia, Mibanco Colombia and Mibanco.
27
| | | Earnings Release 3Q / 2026 | Analysis of 3Q26 Consolidated Results | ||||||||
05. Portfolio Quality and Provisions | |||||||||||
NPL Ratio for Total Loans
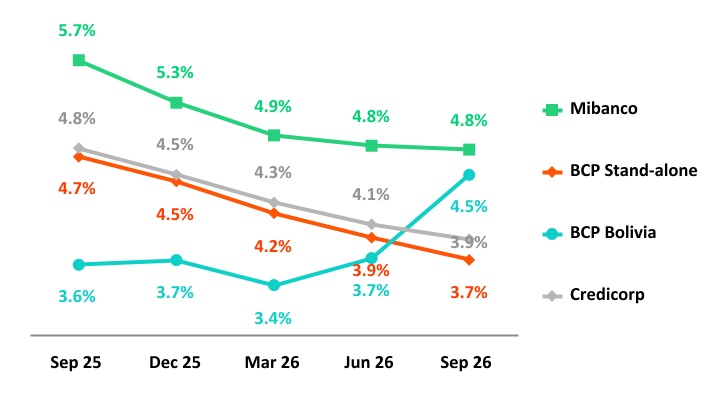
The NPL Ratio at Credicorp dropped -15 bps QoQ to stand at 3.9%, supported by loan growth and positive asset quality trends across the portfolio.
If we analyze the QoQ evolution of the NPL Ratio by subsidiary, we find:
•BCP Stand-alone: The NPL Ratio dropped -22 bps, supported by loan growth and healthy asset quality. The NPL portfolio increased in Retail Banking, although this increase was partially offset by a reduction in Wholesale Banking.
The slight increase in the NPL portfolio was concentrated in vintages associated with digital pilots in SME-Pyme and Consumer, conducted under our experimentation approach. Early-stage delinquency remains concentrated in specific vintages originated during the first half of the year, which retain higher recovery potential, while continuous monitoring has enabled timely corrective actions. This was partially offset by improvements in Wholesale Banking, mainly reflecting repayments from clients in the Construction and Real Estate sectors.
•Mibanco: loan growth outpaced the increase in NPLs, which led the ratio to stand at 4.8% (-2 bps QoQ). Credit deterioration remained below our initial expectations, supported by better recoveries and improvements in risk models and credit guidelines.
NPL Ratio for Total Loans at BCP (1)
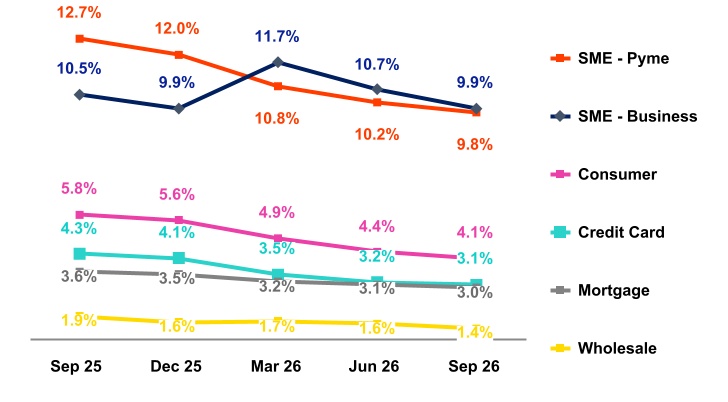
(1) It corresponds to management information by segment in BCP Stand-Alone.
The NPL Ratio at Credicorp dropped -91 bps YoY, driven by lower NPL balances and loan growth, reflecting healthy portfolio quality trends across the portfolio.
If we analyze the YoY evolution of the NPL Ratio by Subsidiary, we see:
•BCP Stand-alone: The NPL Ratio fell -103 bps, led by Retail Banking, which reported a sustained reduction in the NPL portfolio and loan expansion. The improvement reflects the continued strengthening of risk management capabilities, through adjustments in origination, advanced analytics tools, and targeted actions in response to early signs of deterioration. In SMEs, the NPL balance also declined supported by improvements in the early detection of vulnerable portfolios and judicial recoveries in SME-Pyme.
In Individuals, the reduction in the NPL balance was mainly driven by Mortgages, followed by Consumer Loans and Credit Cards, also supported by improved collections processes, including earlier detection and the assignment of specialized contact channels based on customer profiles. In Wholesale Banking, the evolution reflected the same factors discussed in the QoQ analysis.
•Mibanco: The NPL ratio dropped -88 bps YoY, driven mainly by loan growth. The NPL portfolio, in turn, increased slightly, reflecting sustained improvements in origination and collections management.
•Mibanco Colombia: The NPL ratio decreased -52 bps YoY, due to higher loan volumes. The increase in NPL levels was driven by loan growth and specific impacts from extraordinary climatic and physical events during the quarter.
•BCP Bolivia: The NPL ratio rose 91 bps YoY. This increase in NPLs was mainly driven by the implementation of regulatory measures for loan reprogramming and refinancing, which have temporarily impacted portfolio quality.
28
| | | Earnings Release 3Q / 2026 | Analysis of 3Q26 Consolidated Results | ||||||||
05. Portfolio Quality and Provisions | |||||||||||
5.2 Provisions and Cost of Risk of the Total Portfolio
| Loan Portfolio Provisions | Quarter | % Change | Up to | % Change | ||||||||||||||||||||||
| S/000 | 3Q25 | 2Q26 | 3Q26 | QoQ | YoY | Sep 25 | Sep 26 | Sep 26 / Sep 25 | ||||||||||||||||||
| Gross provision for credit losses on loan portfolio | (720,445) | (854,827) | (982,850) | 15.0% | 36.4% | (2,100,143) | (2,449,688) | 16.6% | ||||||||||||||||||
| Recoveries of written-off loans | 117,527 | 123,619 | 154,714 | 25.2% | 31.6% | 340,173 | 408,256 | 20.0% | ||||||||||||||||||
| Provision for credit losses on loan portfolio, net of recoveries | (602,918) | (731,208) | (828,136) | 13.3% | 37.4% | (1,759,970) | (2,041,432) | 16.0% | ||||||||||||||||||
Cost of risk (1) | 1.7% | 1.9% | 2.0% | 16 bps | 34 bps | 1.6% | 1.7% | 10 bps | ||||||||||||||||||
The uptick in provision expenses 3Q26 was fueled by both additional El Niño provisions, reflecting our quarter-end risk assessment, as well as loan growth in retail segments, particularly in higher-yield portfolios. As a result, expenses rose 13.3% QoQ and 37.4% YoY. In this scenario, the Cost of Risk (CoR) stood at 2.0%.
QoQ, underlying provisions remained relatively stable. At BCP Stand-alone, provisions increased in Individuals, mainly due to loan growth and higher provisions associated with specific Consumer and Yape pilots, partially offset by lower provisions in Credit Cards and Mortgages. In SMEs, the increase was driven by loan growth and, in particular, by recent SME Working Capital vintages, with greater penetration into higher-risk segments. In line with our experimentation approach, origination criteria were proactively adjusted for certain pilots, while overall portfolio quality remains healthy. These increases were offset by improved risk performance in Wholesale Banking. At Mibanco, provisions increased in line with loan growth.
YoY, underlying provisions increased mainly at BCP Stand-alone and Mibanco. At BCP, the increase was led by SME-Pyme, reflecting loan growth and greater penetration into new segments. Despite this growth, 3Q26 originations showed healthy performance, with risk indicators trending downward. Yape also contributed to the increase, mainly reflecting loan growth and higher provisions associated with the Multicuota and SME-Pyme pilots. At Mibanco, the increase was mainly driven by loan growth.
Cost of Risk by Subsidiary
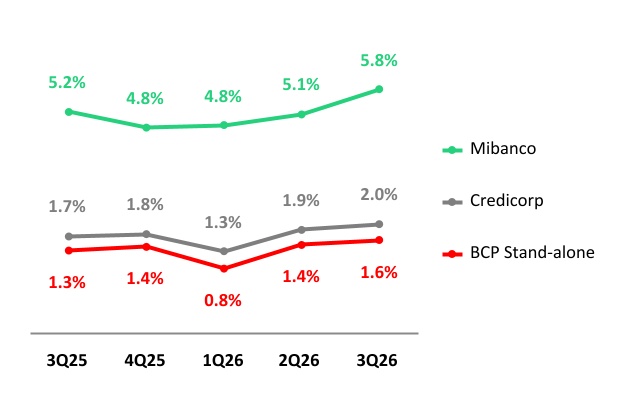
QoQ Cost of Risk Evolution
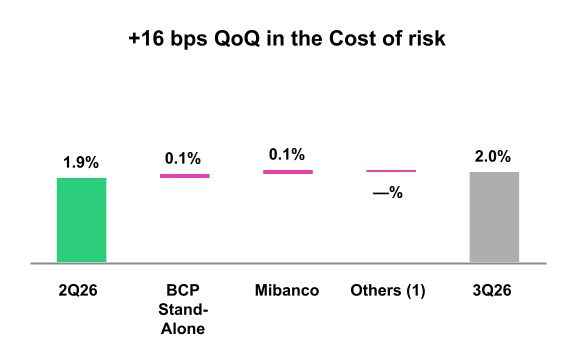
(1)Others include BCP Bolivia, Mibanco Colombia, ASB and eliminations.
YoY Cost of Risk Evolution*
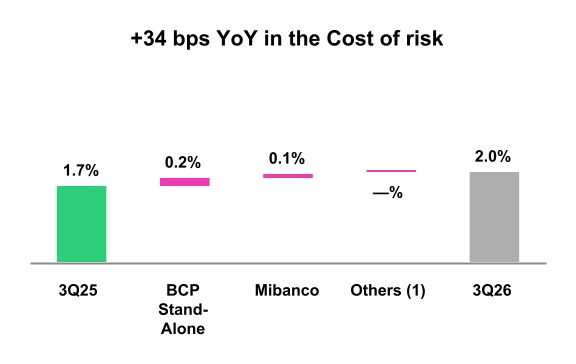
(1)Others include BCP Bolivia, Mibanco Colombia, ASB and eliminations.
29
| | | Earnings Release 3Q / 2026 | Analysis of 3Q26 Consolidated Results | ||||||||
05. Portfolio Quality and Provisions | |||||||||||
YTD Cost of Risk Evolution
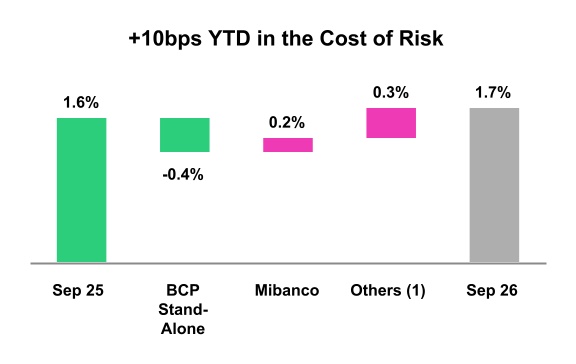
(1)NPL Coverage Ratio (in Quarter-end balances)
| Loan Portfolio Quality and Delinquency Ratios | As of | % Change | |||||||||||||||
| S/000 | Sep 25 | Jun 26 | Sep 26 | QoQ | YoY | ||||||||||||
| Total loans (Quarter-end balance) | 144,752,254 | 159,434,397 | 166,161,042 | 4.2% | 14.8% | ||||||||||||
| Allowance for loan losses | 7,674,040 | 7,575,313 | 7,837,815 | 3.5% | 2.1% | ||||||||||||
| Non-performing loans (NPLs) | 6,969,745 | 6,457,787 | 6,480,558 | 0.4% | -7.0% | ||||||||||||
| Allowance for loan losses over Total loans | 5.3% | 4.8% | 4.7% | -3 bps | -58 bps | ||||||||||||
| Coverage ratio of NPLs | 110.1% | 117.3% | 120.9% | 363 bps | 1083 bps | ||||||||||||
Allowance for loan losses
(in S/ millions)
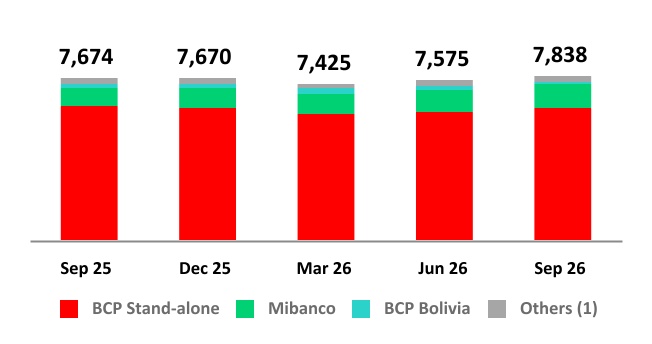
(1)Others include Mibanco Colombia, ASB and eliminations.
QoQ, the allowance for loan losses increased 3.5%, while YoY increased 2.1%, mostly reflecting El Niño related provisions.
The NPL Coverage Ratio at Credicorp stood at 120.9% at the end of 3Q26.
QoQ, the coverage ratio increased 363 bps, driven by a NPL portfolio that remained relatively stable and an increase in allowances for loan losses. YoY, the coverage ratio improved significantly (+1083 bps). This evolution was driven mainly by a drop in the NPL portfolio and an increase in provisions at BCP Stand-alone, where improvements implemented since 2024 for origination, monitoring and early recovery, coupled with a more favorable macroeconomic environment, fueled an upward trajectory.
NPL Coverage Ratio
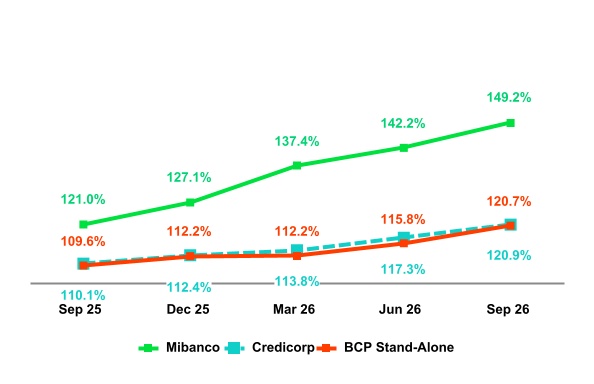
30
| | | Earnings Release 3Q / 2026 | Analysis of 3Q26 Consolidated Results | ||||||||
06 | Other Income | ||||
Executive Summary
•Other Core Income rose 3.2% QoQ and 18.8% YoY. QoQ growth was driven by higher fee income, supported by stronger transactional activity across BCP’s core banking businesses and Yape, partially offset by the normalization of FX gains following a strong 2Q26. YoY growth reflected positive contributions from both fee income and FX gains.
•Other Non-Core Income dropped QoQ (-56.0%) and YoY (-18.3%). QoQ results mainly reflected the normalization of gains on securities following a strong 2Q26 and base effects in Other Non-Operating Income, partially offset by improved results from derivatives held for trading. YoY, results were mainly affected by lower gains on securities.
6. Other Income
| Other Income | Quarter | % Change | Up to | % Change | ||||||||||||||||||||||
| (S/ 000) | 3Q25 | 2Q26 | 3Q26 | QoQ | YoY | Sep 25 | Sep 26 | Sep 26 / Sep 25 | ||||||||||||||||||
| Other Core Income | 1,457,604 | 1,677,087 | 1,731,093 | 3.2% | 18.8% | 4,197,011 | 5,006,348 | 19.3% | ||||||||||||||||||
| Other Non-Core Income | 196,587 | 365,115 | 160,586 | -56.0% | -18.3% | 824,769 | 783,857 | -5.0% | ||||||||||||||||||
| Total Other Income | 1,654,191 | 2,042,202 | 1,891,679 | -7.4% | 14.4% | 5,021,780 | 5,790,205 | 15.3% | ||||||||||||||||||
Other Income dropped 7.4% QoQ while increasing 14.4% YoY and 15.3% YTD. Solid growth in Core income, supported by strong transactional activity, was offset by lower Other non-core income reflecting non-recurring factors.
6.1. Other Core Income
Other Core Income (1) | Quarter | % Change | Up to | % Change | ||||||||||||||||||||||
| (S/ 000) | 3Q25 | 2Q26 | 3Q26 | QoQ | YoY | Sep 25 | Sep 26 | Sep 26 / Sep 25 | ||||||||||||||||||
| Fee Income | 1,063,032 | 1,187,608 | 1,280,004 | 7.8% | 20.4% | 3,081,609 | 3,616,896 | 17.4% | ||||||||||||||||||
| Net Gain on Foreign Exchange Transactions | 394,572 | 489,479 | 451,089 | -7.8% | 14.3% | 1,115,402 | 1,389,452 | 24.6% | ||||||||||||||||||
| Total Other Core Income | 1,457,604 | 1,677,087 | 1,731,093 | 3.2% | 18.8% | 4,197,011 | 5,006,348 | 19.3% | ||||||||||||||||||
Other core income increased 3.2% QoQ, 18.8% YoY and 19.3% YTD. It represented 29.3% of Credicorp’s total risk-adjusted income in 3Q26, up from 28.8% in 2Q26 and 27.8% in 3Q25, reflecting the growing contribution of recurring, transaction-driven revenues to Credicorp’s income mix.
• QoQ growth was driven by Fee Income, which increased +7.8% and is discussed in the following section. This increase was partially offset by a 7.8% decline in Net Gain on Foreign Exchange Transactions, mainly reflecting the normalization of FX activity at BCP Stand-alone following the elevated transaction volumes registered amid electoral volatility in 2Q26. Furthermore, lower FX gains at BCP Bolivia also contributed to the decline, reflecting changes in the exchange rate environment and Central Bank intervention during September.
•YoY, growth was driven primarily by a +20.4% increase in Fee Income and, to a lesser extent, by a 14.3% increase in Net Gain on Foreign Exchange Transactions. At BCP Stand-alone, FX gains rose 16.3%, supported by higher transaction volumes and better pricing management. This positive performance was partially offset by lower FX gains at BCP Bolivia reflecting the same exchange-rate dynamics described in the QoQ analysis.
•YTD, Other Core Income increased 19.3%, supported by growth in both Fee Income and Net Gain on Foreign Exchange Transactions, which rose 17.4% and 24.6%, respectively. Fee-income growth was driven primarily by BCP Stand-alone, while the increase in FX gains reflected higher transaction volumes and better pricing management at BCP Stand-alone, together with a stronger contribution from Credicorp Capital’s Capital Markets business.
31
| | | Earnings Release 3Q / 2026 | Analysis of 3Q26 Consolidated Results | ||||||||
At the end of 3Q26, Other Core Income as a percent of average assets stood at 2.43% compared with 2.39% in 2Q26 and 2.31% in 3Q25.
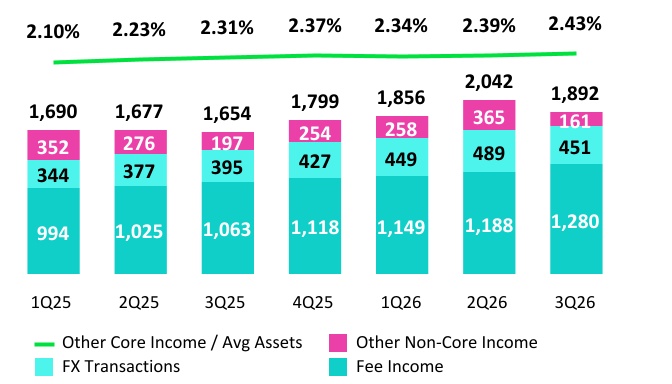
Fee Income by Subsidiary
| Fee Income by Subsidiary | Quarter | % Change | Up to | % Change | ||||||||||||||||||||||
| (S/000) | 3Q25 | 2Q26 | 3Q26 | QoQ | YoY | Sep 25 | Sep 26 | Sep 26 / Sep 25 | ||||||||||||||||||
BCP Stand-Alone | 873,187 | 970,331 | 1,070,483 | 10.3% | 22.6% | 2,558,334 | 3,002,360 | 17.4% | ||||||||||||||||||
BCP Bolivia | 10,244 | 12,443 | 9,775 | -21.4% | -4.6% | 37,640 | 39,499 | 4.9% | ||||||||||||||||||
| Mibanco | 28,873 | 38,447 | 42,491 | 10.5% | 47.2% | 84,845 | 115,208 | 35.8% | ||||||||||||||||||
| Mibanco Colombia | 14,314 | 23,128 | 28,713 | 24.1% | 100.6% | 35,835 | 69,329 | 93.5% | ||||||||||||||||||
| Pacífico | -5,123 | -4,638 | -2,771 | -40.3% | -45.9% | -15,167 | -12,613 | -16.8% | ||||||||||||||||||
| Prima | 95,006 | 94,901 | 93,532 | -1.4% | -1.6% | 286,311 | 279,628 | -2.3% | ||||||||||||||||||
| ASB | 12,615 | 11,174 | 12,988 | 16.2% | 3.0% | 39,282 | 37,758 | -3.9% | ||||||||||||||||||
| Credicorp Capital | 148,115 | 171,304 | 179,513 | 4.8% | 21.2% | 418,676 | 511,818 | 22.2% | ||||||||||||||||||
Eliminations and Others (1) | -114,199 | -129,482 | -154,720 | 19.5% | 35.5% | -364,147 | -426,091 | 17.0% | ||||||||||||||||||
| Total Net Fee Income | 1,063,032 | 1,187,608 | 1,280,004 | 7.8% | 20.4% | 3,081,609 | 3,616,896 | 17.4% | ||||||||||||||||||
(1)Correspond mainly to the eliminations of bancassurance between Pacifico, BCP, and Mibanco.
Fee income increased 7.8% QoQ, 20.4% YoY and 17.4% YTD, driven primarily by BCP Stand-alone. Credicorp Capital and the Mibanco operations also contributed to growth, particularly YoY and YTD.
•QoQ, growth was driven primarily by BCP Stand-alone, where fee income increased 10.3%, Credicorp Capital and the Mibanco operations also contributed positively, although to a lesser extent. The drivers of BCP Stand-alone’s performance are discussed in the following section.
•YoY and YTD, BCP Stand-alone remained the principal contributor to fee-income growth. Credicorp Capital also reported higher fee income from its Capital Markets and Investment Funds businesses. Within Capital Markets, Sales and Corporate benefited from higher transaction levels amid global market volatility. Mibanco Peru and Mibanco Colombia provided an additional contribution, supported by higher disbursements and the resulting increase in commissions.
Fee Income at BCP Stand-alone
Compositions of Fee Income at BCP Stand-alone (*)
| BCP Stand-alone Fees | Quarter | % Change | Up to | % Change | ||||||||||||||||||||||
| (S/ 000,000) | 3Q25 | 2Q26 | 3Q26 | QoQ | YoY | Sep 25 | Sep 26 | Sep 26 / Sep 25 | ||||||||||||||||||
Payments and transactional services (1) | 271 | 282 | 347 | 23.0% | 27.8% | 841 | 923 | 9.8% | ||||||||||||||||||
Yape (2) | 164 | 214 | 230 | 7.4% | 39.8% | 417 | 643 | 54.3% | ||||||||||||||||||
Liability and Transactional Accounts (3) | 204 | 210 | 226 | 7.4% | 10.4% | 602 | 645 | 7.2% | ||||||||||||||||||
Loan Disbursement (4) | 103 | 113 | 125 | 10.7% | 21.6% | 304 | 350 | 14.9% | ||||||||||||||||||
| Off-balance sheet | 54 | 52 | 50 | -3.7% | -5.9% | 163 | 156 | -3.9% | ||||||||||||||||||
| Insurances | 35 | 47 | 50 | 7.0% | 43.7% | 122 | 143 | 17.0% | ||||||||||||||||||
| Wealth Management and Corporate Finance | 19 | 23 | 23 | -0.8% | 21.0% | 54 | 70 | 29.2% | ||||||||||||||||||
Others (5) | 23 | 29 | 20 | -32.6% | -14.8% | 55 | 71 | 28.9% | ||||||||||||||||||
| Total | 873 | 970 | 1,070 | 10.3% | 22.6% | 2,558 | 3,002 | 17.4% | ||||||||||||||||||
(*)Management figures.
(1)Includes fees from credit and debit card activity, payments, Culqi and collections.
32
| | | Earnings Release 3Q / 2026 | Analysis of 3Q26 Consolidated Results | ||||||||
(2)Beginning in 3Q26, accounting reclassifications associated with Yape’s transactional fee expenses have been incorporated. These reclassifications affected Administrative and General Expenses and Fee Income. Figures for prior periods have been restated for comparability and may differ from those previously reported.
(3)Corresponds to fees from Account maintenance, interbank transfers, national transfers, and international transfers.
(4)Corresponds to fees from retail and wholesale loan disbursements.
(5)Use of third-party networks, other services to third parties, and Commissions in foreign branches.
Fee Income at BCP Stand-alone increased 10.3% QoQ, 22.6% YoY and 17.4% YTD, driven by continued transactional growth across core banking businesses and the integration of Culqi’s merchant payment platform. Recurring transactional fee growth was mainly attributable to:
•QoQ, growth was driven primarily by Payments and Transactional Services, reflecting higher credit- and debit-card purchase and processed volumes, particularly in July during the World Cup, lower loyalty-program expenses Liability and Transactional Accounts also contributed, through higher interbank and international transfer volumes. Yape maintained its positive momentum, reflecting higher transaction volumes across Checkout, Service payments and Merchant QR Payments. Service Payments benefited from the education enrollment cycle, while Merchant QR Payments were supported by stronger consumption and retail campaigns during the quarter.
•YoY, growth was broad-based. Payments and Transactional Services benefited from higher card activity, network-usage income and services provided to third parties, while Yape´s monetized functionalities continued to expand across its user and merchant ecosystem. Higher transfer volumes and loan origination also supported growth in Liability and Transactional Accounts, Loan Disbursements and associated insurance commissions.
•YTD, growth was led by Yape, reflecting the continued expansion of its monetized functionalities and higher TPV through Yape Business, which translated into higher fee income. Wealth Management and Corporate Finance provided an additional contribution, reflecting greater institutional activity in capital markets.
6.2 Other Non-Core Income
Other Non-Core Income (1) | Quarter | % Change | Up to | % Change | ||||||||||||||||||||||
| S/000 | 3Q25 | 2Q26 | 3Q26 | QoQ | YoY | Sep 25 | Sep 26 | Sep 26 / Sep 25 | ||||||||||||||||||
| Net Gain on Securities | 111,977 | 248,844 | 57,377 | -76.9% | -48.8% | 263,002 | 441,858 | 68.0% | ||||||||||||||||||
Net Gain from Associates (2) | 5,192 | 6,156 | 6,125 | -0.5% | 18.0% | 35,816 | 21,577 | -39.8% | ||||||||||||||||||
Net Gain of Derivatives Held for Trading (3) | 244 | -14,697 | 51,031 | n.a. | n.a. | 40,161 | 63,797 | 58.9% | ||||||||||||||||||
| Net Gain from Exchange Differences | 7,518 | 44,160 | 16,263 | -63.2% | 116.3% | 33,672 | 68,980 | 104.9% | ||||||||||||||||||
| Other Non-operative Income | 71,656 | 80,652 | 29,790 | -63.1% | -58.4% | 452,118 | 187,645 | -58.5% | ||||||||||||||||||
| Total Other Non-Core Income | 196,587 | 365,115 | 160,586 | -56.0% | -18.3% | 824,769 | 783,857 | -5.0% | ||||||||||||||||||
Other Non-Core Income declined 56.0% QoQ, 18.3% YoY and 5.0% YTD.
•QoQ, the decline was driven primarily by lower Net Gain on Securities. At Credicorp Capital Colombia, results normalized following a strong 2Q26, when volatility associated with the electoral environment created favorable trading opportunities. BCP Bolivia also contributed to the decline following the reclassification of certain revenues from fees to Net Interest Income. Other Non-Operating Income decreased mainly due to a base effect of a property-sale gain recorded by Pacífico in 2Q26. These effects were partially offset by improved results from derivatives held for trading at Credicorp Capital, which moved from a loss in 2Q26 to a gain in 3Q26.
•YoY, the decline was mainly attributable to lower Net Gain on Securities, primarily at BCP, and lower Other Non-Operating Income. The latter reflected a high comparison base at Pacífico, which recorded releases of administrative and contingent provisions in 3Q25. These effects were partially offset by improved results from derivatives held for trading at Credicorp Capital and by a recovery in the value of certain securities in Pacífico’s investment portfolio following rating downgrades recorded in the previous year.
•YTD, Other Non-Core Income declined 5.0%, mainly due to the high comparison base in Other Non-Operating Income, which included an extraordinary gain related to the acquisition of Banmédica in 1Q25. Excluding this effect, Other Non-Core Income would have increased 33%. The decline was partially offset by higher Net Gain on Securities, mainly at Credicorp Capital Colombia, supported by more favorable conditions for its fixed-income portfolio during the first nine months of the year. Improved results from Derivatives held for trading at Pacifico and Credicorp capital provided additional support.
33
| | | Earnings Release 3Q / 2026 | Analysis of 3Q26 Consolidated Results | ||||||||
07 | Insurance Underwriting Result and Medical Services | ||||
Executive Summary
•QoQ, the IUR increased 25.8% due to (i) Life, where growth was led by Group Life, which reported a drop in claims and a seasonal increase in premiums, and by Credit Life, which reported growth in premiums through Bancassurance (up on the back of loan growth) and Alliances, (ii) Corporate Health, which registered growth in revenues from new accounts and renewals, and (iii) P&C, where Medical Assistance reported an uptick in premiums through the Brokers and Bancassurance channels and a drop in claims.
•YoY, the IUR dropped 6.7% due to the evolution of Life, particularly of D&S, where a base effect was reported for reserve releases for SISCO in 3Q25. This impact was partially mitigated by the positive evolution of P&C, which was driven mainly by Medical Assistance, where premiums were up and claims were down.
•YTD, the IUR fell 11.1%, driven by Life, due to a drop in the result for the D&S line (through the same dynamics seen YoY). This contraction was partially offset by the evolution of Credit Life, Individual Life and Annuities, where the policy base continues to expand through issuances in Bancassurance and Retail, thereby establishing these as a source of structural growth for the business.
Insurance Underwriting Result
The Insurance Underwriting Result comprises three main businesses, each of which plays a differentiated strategic role. The main contributor to the result is Life, where optional insurance products distributed through bancassurance and other Credicorp channels offer key opportunities for growth. P&C’s result combines high-growth retail products, which are also distributed through Credicorp channels, with Commercial Lines, which primarily serve corporate clients. Corporate Health, in turn, benefits from its integration with our own network of hospitals and outpatient service centers, which are reported under Medical Services. This integration puts our business in a differentiated position to serve a market where private healthcare remains underdeveloped.
Our primary avenue for growth is retail, given that insurance penetration in Peru remains below the Latin American average. Our goal is to close this gap by distributing Life and P&C products across Credicorp’s ecosystem, which includes BCP, Mibanco, and Yape, and by forging alliances with third parties.
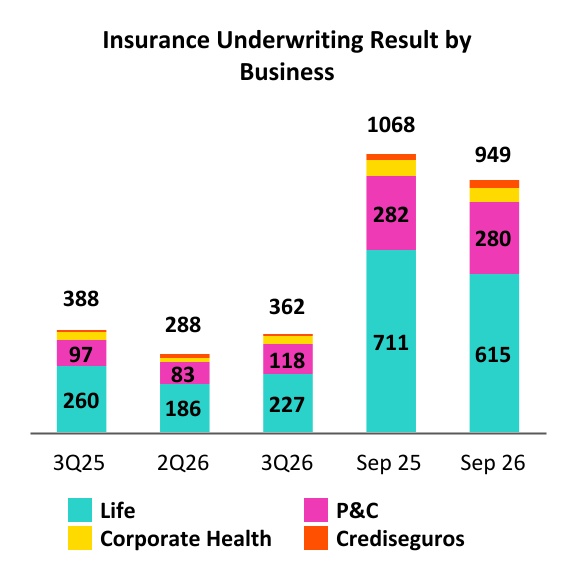
34
| | | Earnings Release 3Q / 2026 | Analysis of 3Q26 Consolidated Results | ||||||||
Life Insurance
| Insurance Underwriting Result | Quarter | % Change | Up to | % Change | ||||||||||||||||||||||
| S/ million | 3Q25 | 2Q26 | 3Q26 | QoQ | YoY | Sep 25 | Sep 26 | Sep 26 / Sep 25 | ||||||||||||||||||
| Credit Life | 137.2 | 133.3 | 150.3 | 12.8% | 9.5% | 391.2 | 447.9 | 14.5% | ||||||||||||||||||
| Individual Life | 18.1 | 32.6 | 35.2 | 8.0% | 94.5% | 71.7 | 89.5 | 24.8% | ||||||||||||||||||
| Group Life | 41.7 | 14.4 | 32.2 | 123.6% | -22.8% | 111.4 | 57.6 | -48.3% | ||||||||||||||||||
| Disability & Survivorship | 62.3 | 4.8 | (1.4) | n.a. | n.a. | 120.1 | 23.0 | -80.8% | ||||||||||||||||||
| Annuities | (2.7) | (0.7) | 8.7 | n.a. | n.a. | 8.7 | 11.3 | 29.9% | ||||||||||||||||||
| Personal Accidents | 3.1 | 1.2 | 1.7 | 41.7% | -45.2% | 9.1 | 5.4 | -40.7% | ||||||||||||||||||
| Total | 259.9 | 185.6 | 227.1 | 22.4% | -12.6% | 711.4 | 614.8 | -13.6% | ||||||||||||||||||
Credit Life is the main driver of the Insurance Underwriting result in Life, followed by Individual Life. Credit Life products, which are linked to loans, benefit from premiums distributed through bancassurance channels and alliances. Individual Life products are distributed through the same channels and include protection and savings options within the retail segment. The Group Life, D&S, Annuities and Personal Accidents lines are secondary contributors to the evolution of the Life line.
QoQ, the Insurance Underwriting Result rose 22.4%, driven mainly by Credit Life, which reported sustained growth in premium turnover in Bancassurance and Alliances. Group Life’s result was bolstered by a drop in claims from Supplementary Insurance for High Risk Occupations (SCTR), while Individual Life continued to register solid results on the back of our strategy to expand placements of optional protection and savings policies in the retail segment.
YoY, the Insurance Underwriting Result dropped 12.6%. This evolution was fueled mainly by D&S, which registered a base effect for releases of claims registered in 3Q25, and secondarily by Group Life, which reported an uptick in claims.
YTD, the Insurance Underwriting Result decreased, driven by inflation-related increases in claims expenses in Group Life (which was offset by the evolution of the Net Interest Income line) and by a drop in claims releases in D&S. The combined impact of the aforementioned drivers was partially offset by Credit Life, which reported growth in premiums in all channels.
P&C Insurance
| Insurance Underwriting Result | Quarter | % Change | Up to | % Change | ||||||||||||||||||||||
| S/ million | 3Q25 | 2Q26 | 3Q26 | QoQ | YoY | Sep 25 | Sep 26 | Sep 26 / Sep 25 | ||||||||||||||||||
| Medical Assistance | 38.0 | 49.3 | 66.4 | 34.7% | 74.7% | 83.0 | 162.1 | 95.3% | ||||||||||||||||||
| Personal Lines | 43.0 | 48.0 | 55.9 | 16.5% | 30.0% | 152.0 | 150.9 | -0.7% | ||||||||||||||||||
| Commercial Lines | 6.0 | (16.7) | (5.0) | -70.1% | n.a. | 17.0 | (28.9) | n.a. | ||||||||||||||||||
| Vehicles | 11.0 | 2.7 | 0.6 | -77.8% | -94.5% | 31.0 | (4.1) | n.a. | ||||||||||||||||||
| Total | 97.5 | 83.4 | 117.8 | 41.2% | 20.9% | 282.4 | 279.9 | -0.9% | ||||||||||||||||||
Personal Lines and Medical Assistance are the main contributors to P&C earnings; Vehicles (Cars and SOAT) are secondary contributors. These businesses benefit from distribution through the bancassurance and broker channels, respectively. Commercial Lines, which serve mainly corporate clients, present different dynamics for claims, premiums, and reinsurance and complement P&C’s offerings.
QoQ and YoY, the Insurance Underwriting Result rose +41.2% and +20.9%, respectively, driven by (i) Medical Assistance, which reported an uptick in premiums for indemnity and comprehensive health products and a drop in claims due to IBNR reserve releases, (ii) Personal Lines, which registered growth in sales of Card Protection and Home Insurance policies. The aforementioned was partially offset by the results for Commercial Lines and Vehicles, which were impacted by a drop in premiums due to a reduction in the exchange rate and high competition in the market.
YTD, the Insurance Underwriting Result dropped 0.9% due to the evolution in Commercial Lines and Vehicles, which reported a drop in premiums due to a reduction in the exchange rate and an uptick in claims. The aforementioned was
35
| | | Earnings Release 3Q / 2026 | Analysis of 3Q26 Consolidated Results | ||||||||
partially offset by the result for Medical Assistance, which reported growth in sales of individual insurance products and comprehensive health plans.
Corporate Health
The Corporate Health business continued to deliver favorable results, both QoQ and YoY, driven primarily by premium growth, which rose on the back of an expanding customer base and issuances of new accounts for regular and optional plans. In addition, disciplined claims management throughout the year led to a lower claims levels, further supporting earnings growth in the business.
Medical Services Result
QoQ and YoY, Medical Services Results increased 2.2% and 10.0%, respectively. The improvement in results was driven by (i) higher sales revenue, in line with an increase in outpatient visits and hospital admissions. This uptick was partially offset by (ii) higher costs, mainly reflecting increases in material costs and medical professional fees.
YTD, results rose 35.8%. When interpreting these results, it is important to note that 1Q26 contemplates three months of reporting, whereas 1Q25 includes only one month because Pacifico Salud was consolidated in March.
The Medical Services business continues to demonstrate solid commercial dynamics and cost control.
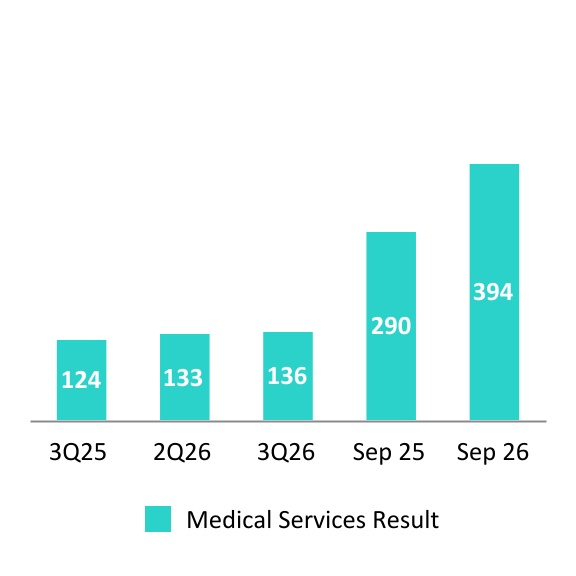
| ▲ | ||
2.2% QoQ | ||
| ▲ | ||
10.0% YoY | ||
| ▲ | ||
35.8% YTD | ||
36
| | | Earnings Release 3Q / 2026 | Analysis of 3Q26 Consolidated Results | ||||||||
08 | Operating Expenses | ||||
Executive Summary
•Operating expenses increased 13.6% YTD, driven mainly by core business at BCP and by initiatives in the Innovation portfolio at the Credicorp level.
•Core business expenses rose primarily through BCP, which was impacted by (i) higher administrative expenses, which increased due to growth in spending for the use of cloud infrastructure and other IT-related services, and (ii) an increase in expenses for Employee salaries and benefits, which rose on the back of initiatives to develop commercial, technological and transactional capacities and through growth in provisions for variable compensation.
•Expenses for innovation initiatives at the Credicorp level increased 32.5% YTD.
Total operating expenses
| Operating expenses | Quarter | % Change | Up to | % Change | ||||||||||||||||||||||
| S/ 000 | 3Q25 | 2Q26 | 3Q26 | QoQ | YoY | Sep 25 | Sep 26 | Sep 26 / Sep 25 | ||||||||||||||||||
| Salaries and employees benefits | 1,341,137 | 1,475,704 | 1,548,820 | 5.0% | 15.5% | 4,007,293 | 4,483,945 | 11.9% | ||||||||||||||||||
| Administrative and general expenses | 1,068,459 | 1,114,932 | 1,207,786 | 8.3% | 13.0% | 2,904,287 | 3,384,384 | 16.5% | ||||||||||||||||||
| Depreciation and amortization | 219,800 | 235,204 | 240,861 | 2.4% | 9.6% | 636,228 | 717,433 | 12.8% | ||||||||||||||||||
| Association in participation | 65 | 155 | 124 | -20.0% | 90.8% | 7,235 | 452 | -93.8% | ||||||||||||||||||
| Operating expenses | 2,629,461 | 2,825,995 | 2,997,591 | 6.1% | 14.0% | 7,555,043 | 8,586,214 | 13.6% | ||||||||||||||||||
The analysis of expenses will be based on YTD movements to eliminate seasonal effects between quarters.
Operating expenses rose 13.6%, driven primarily by:
•The increase in Administrative Expenses was driven by BCP Stand-alone, Mibanco and Pacifico. In BCP Stand-alone, transactions through digital channels rose, which generated higher expenses for use of cloud infrastructure and other IT-related services. Mibanco reported an uptick in expenses that was fueled primarily by strategic project roll-outs to develop technological and distribution capacities. At Pacifico, expenses rose due to the company’s consolidation of the health business, which began in March 2025.
•The uptick in Employee Salaries and Benefits, which was driven mainly by: (i) BCP Stand-alone, which registered an increase in hiring associated with projects focused on the development of commercial, technological and transactional capacities and growth in provisions to cover variable compensation, which rose alongside an increase in results; and (ii) Mibanco, where higher expenses were fueled mainly by an uptick in provisions for variable compensation, which was attributable to the positive evolution of results.
37
| | | Earnings Release 3Q / 2026 | Analysis of 3Q26 Consolidated Results | ||||||||
08. Operating Expenses | |||||||||||
Administrative Expenses
| Administrative and General Expenses | Quarter | % Change | Up to | % Change | ||||||||||||||||||||||
| S/ 000 | 3Q25 | 2Q26 | 3Q26 | QoQ | YoY | Sep 25 | Sep 26 | Sep 26 / Sep 25 | ||||||||||||||||||
| IT expenses and IT third-party services | 336,894 | 433,286 | 432,553 | -0.2% | 28.4% | 963,006 | 1,257,970 | 30.6% | ||||||||||||||||||
| Advertising and Loyalty programs | 133,510 | 130,559 | 153,714 | 17.7% | 15.1% | 330,927 | 407,262 | 23.1% | ||||||||||||||||||
| Taxes and contributions | 90,710 | 103,586 | 109,501 | 5.7% | 20.7% | 260,378 | 323,255 | 24.1% | ||||||||||||||||||
| Audit Services, Consulting and professional fees | 120,177 | 89,752 | 113,650 | 26.6% | -5.4% | 283,335 | 291,227 | 2.8% | ||||||||||||||||||
| Transport and communications | 64,565 | 66,737 | 67,239 | 0.8% | 4.1% | 175,766 | 182,491 | 3.8% | ||||||||||||||||||
| Repair and maintenance | 43,719 | 36,933 | 45,754 | 23.9% | 4.7% | 113,240 | 111,068 | -1.9% | ||||||||||||||||||
| Agents’ Fees | 27,807 | 24,545 | 23,834 | -2.9% | -14.3% | 81,976 | 72,453 | -11.6% | ||||||||||||||||||
| Services by third-party | 27,766 | 29,484 | 30,682 | 4.1% | 10.5% | 75,836 | 83,594 | 10.2% | ||||||||||||||||||
| Leases of low value and short-term | 34,858 | 46,250 | 38,468 | -16.8% | 10.4% | 102,972 | 126,047 | 22.4% | ||||||||||||||||||
| Miscellaneous supplies | 16,993 | 18,984 | 14,315 | -24.6% | -15.8% | 54,568 | 50,071 | -8.2% | ||||||||||||||||||
| Security and protection | 16,888 | 17,586 | 17,727 | 0.8% | 5.0% | 50,774 | 53,320 | 5.0% | ||||||||||||||||||
| Subscriptions and quotes | 20,774 | 21,542 | 22,993 | 6.7% | 10.7% | 58,877 | 65,384 | 11.1% | ||||||||||||||||||
| Electricity and water | 11,390 | 13,471 | 12,271 | -8.9% | 7.7% | 34,178 | 35,919 | 5.1% | ||||||||||||||||||
| Electronic processing | 8,935 | 10,903 | 12,440 | 14.1% | 39.2% | 24,332 | 33,410 | 37.3% | ||||||||||||||||||
| Insurance | 34,401 | (3,152) | 10,000 | -417.3% | -70.9% | 62,561 | 29,950 | -52.1% | ||||||||||||||||||
| Cleaning | 6,474 | 7,604 | 7,952 | 4.6% | 22.8% | 20,046 | 22,719 | 13.3% | ||||||||||||||||||
| Others | 72,598 | 66,862 | 94,693 | 41.6% | 30.4% | 211,515 | 238,244 | 12.6% | ||||||||||||||||||
| Total | 1,068,459 | 1,114,932 | 1,207,786 | 8.3% | 13.0% | 2,904,287 | 3,384,384 | 16.5% | ||||||||||||||||||
YTD, administrative expenses rose 16.5%. This uptick was fueled mainly by BCP Stand-alone, which reported higher expenses for IT and IT third-party services, and Advertising and Loyalty programs. Mibanco and Pacifico were secondary contributors to growth.
Core operating expenses and the Innovation Portfolio
Operating Expenses (1) | Quarter | % Change | Up to | % Change | ||||||||||||||||||||||
| S/ 000 | 3Q25 | 2Q26 | 3Q26 | QoQ | YoY | Sep 25 | Sep 26 | Sep 26 / Sep 25 | ||||||||||||||||||
| Operating Expenses Ex Innovation | 2,264,046 | 2,367,855 | 2,514,471 | 6.2% | 11.1% | 6,520,543 | 7,215,164 | 10.7% | ||||||||||||||||||
Innovation Portfolio (2) | 365,415 | 458,140 | 483,120 | 5.5% | 32.2% | 1,034,500 | 1,371,050 | 32.5% | ||||||||||||||||||
| Total Operating Expenses | 2,629,461 | 2,825,995 | 2,997,591 | 6.1% | 14.0% | 7,555,043 | 8,586,214 | 13.6% | ||||||||||||||||||
(1)Management figures.
(2)Includes innovation portfolio initiatives in subsidiaries and Krealo.
YTD, the 13.6% rise in operating expenses was driven mainly by core businesses at BCP Stand-alone and by the innovation portfolio at the Credicorp level. Expenses for innovation portfolio initiatives represented 16.0% of total expenses, ticking up 32.5% YTD, supporting continued growth in risk-adjusted revenues.
Growth in core business expenses at BCP Stand-alone was fueled by:
•Core business expenses, excluding IT
Spending for Employee Salaries and Benefits was up, driven by (i) an uptick in initiatives to develop commercial, technological and transactional capacities, and (ii) an increase in provisions for variable compensation, which rose alongside an uptick in results.
•Technology expenses (IT)
Fueled by an increase in spending for licenses and outsourced IT services, driven by increased hiring of specialized personnel.
38
| | | Earnings Release 3Q / 2026 | Analysis of 3Q26 Consolidated Results | ||||||||
09 | Operating Efficiency | ||||
Executive Summary
YTD, the efficiency ratio stood at 45.4% (-26 bps), remaining within the guidance range, as operating income, driven primarily by net interest income, grew at a faster pace than operating expenses, which were associated with BCP’s core business and initiatives within its innovation portfolio.
Efficiency ratio (1) reported by subsidiary
| Subsidiary | Quarter | % Change | Up to | % Change | ||||||||||||||||||||||
| 3Q25 | 2Q26 | 3Q26 | QoQ | YoY | Sep 25 | Sep 26 | Sep 26 / Sep 25 | |||||||||||||||||||
| BCP Stand-alone | 39.9% | 38.5% | 39.1% | 54 bps | -86 bps | 38.7% | 38.8% | 8 bps | ||||||||||||||||||
| BCP Bolivia | 59.0% | 57.1% | 67.4% | 1028 bps | 835 bps | 65.5% | 62.8% | -278 bps | ||||||||||||||||||
| Mibanco Peru | 49.4% | 46.8% | 46.9% | 11 bps | -255 bps | 51.4% | 47.6% | -379 bps | ||||||||||||||||||
| Mibanco Colombia | 63.7% | 58.0% | 58.7% | 70 bps | -504 bps | 66.4% | 60.1% | -627 bps | ||||||||||||||||||
| Pacifico | 38.2% | 40.2% | 35.7% | -451 bps | -252 bps | 36.1% | 38.3% | 217 bps | ||||||||||||||||||
| Prima AFP | 52.5% | 51.2% | 52.4% | 125 bps | -5 bps | 52.7% | 53.6% | 82 bps | ||||||||||||||||||
| Credicorp | 46.4% | 45.4% | 45.1% | -24 bps | -125 bps | 45.7% | 45.4% | -26 bps | ||||||||||||||||||
(1)Operating expenses / Operating income (under IFRS 17). Operating expenses = Salaries and employee benefits + Administrative expenses + Depreciation and amortization + Association in participation + Acquisition cost. Operating income = Net interest, similar income, and expenses + Fee income + Net gain on foreign exchange transactions + Net gain from associates +Net gain on derivatives held for trading + Net gain from exchange differences + Insurance Underwriting Results + Results for Medical Services
This analysis will be based on YTD movements to eliminate seasonal effects between quarters.
The efficiency ratio evolved as expected and remained within the guidance range, reaching 45.4% (-26 bps). This performance was supported by higher operating revenues, driven by growth in net interest income and other core income, which offset higher expenses associated with the expansion of BCP Individual’s core business and investments in Credicorp’s innovation portfolio. These investments are aimed at strengthening capabilities, and securing sustainable competitive advantages over the long term.
39
| | | Earnings Release 3Q / 2026 | Analysis of 3Q26 Consolidated Results | ||||||||
10 | Regulatory Capital | ||||
Executive Summary
•At the end of 3Q26, the regulatory capital ratio stood at 123%, above the regulatory minimum.
•The IFRS CET1 ratio at BCP Stand-alone reported a drop of -125 bps YoY to stand at 11.92%, which is above our internal appetite of 11%. This decline was fueled by an increase in risk-weighted assets (RWA) for credit risk, which rose on the back of growth in the retail portfolio. Said growth was offset by an increase in Retained Earnings, which was driven by business expansion.
•The IFRS CET1 ratio at Mibanco dropped -201 bps YoY to stand at 15.14%, which was above our internal appetite of 15%. This ratio’s decline was fueled by an increase in RWAs, which was in turn driven by portfolio growth. The uptick in RWAs was partially offset by an increase in Retained Earnings, which rose on the back of business expansion.
10.1 Regulatory Capital at Credicorp
Capital analysis of Financial Group.
At the end of 3Q26, the Regulatory Capital Ratio stood at 123%, above the minimum required. The reduction of 293 bps QoQ was driven by: (i) an increase in capital requirements to cover loan growth at BCP Stand-alone and Mibanco; (ii) a decrease in the balance for subordinated debt, after the execution of a scheduled call of a bond at BCP; and (iii) a drop in unrealized gains driven by the fixed income portfolio. These impacts were partially offset by an increase in retained earnings, which was driven by business expansion.
Capital Coverage Ratios
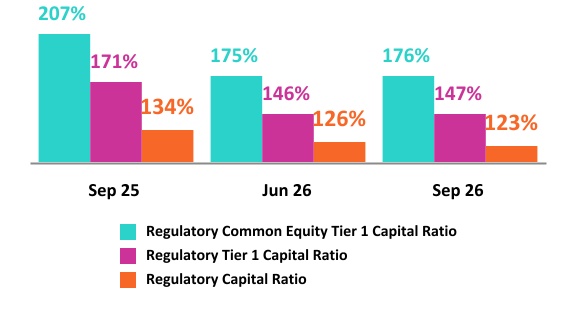
YoY, the ratio fell 1141 bps. This evolution was fueled mainly by an increase in regulatory capital requirements and secondarily, by a decrease in Unrealized Profit, both of which were driven by the same dynamics that drove the QoQ results. The reduction in Unrealized gains was offset by an uptick in Reserves, which was driven by earnings capitalization in 2025, and by growth in the balance for Subordinated Debt, which was triggered by issuances at subsidiaries throughout the year.
The dynamics explained, related to the increase of regulatory capital requirements to cover loan growth, the drop in unrealized gains and the increase in retained earnings, also impacted the evolution of the Regulatory Tier 1 ratio, which stood at 147% (+80 bps QoQ, -2458 bps YoY), and the Regulatory CET 1 ratio, which situated at 176% (+82 bps QoQ, -3187 bps YoY).
40
| | | Earnings Release 3Q / 2026 | Analysis of 3Q26 Consolidated Results | ||||||||
10. Regulatory Capital | |||||||||||
10.2 Analysis of Capital at BCP Stand-alone
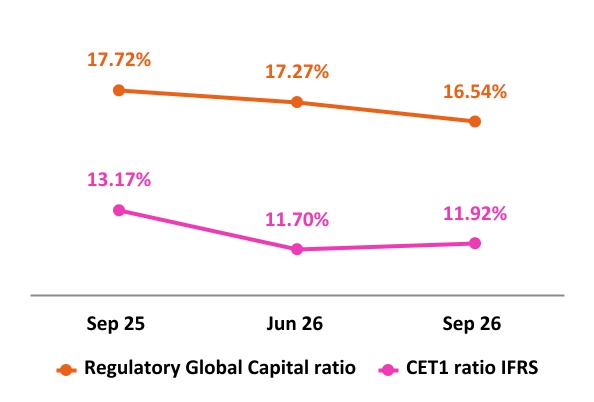
The IFRS CET 1 Ratio at BCP Stand-alone rose 23 bps QoQ to stand at 11.92% at the end of 3Q26, which was above our internal appetite of 11%. This increase was fueled mainly by growth in Retained Earnings (+24.4%), which ticked up alongside business expansion. The result for Retained earnings was partially offset by (i) an increase in RWAs (+3.4%), and credit RWAS in particular, which was fueled by growth in retail loans, and (ii) to a lesser extent, by a drop in unrealized gains due to a devaluation of fixed income instruments, which were impacted by rate increases.
YoY, the ratio dropped -125 bps after growth in credit RWAs outstripped the expansion reported by Retained Earnings.
Finally, under current regulatory parameters, the local CET 1 ratio stood at 11.69%, which compares favorably with the minimum of 8.38% required at the end of September 2026. The Regulatory Global Capital ratio stood at 16.54% (-73 bps QoQ and -118 bps YoY),which was above the regulatory minimum of 14.91%.
10.3 Capital Analysis at Mibanco
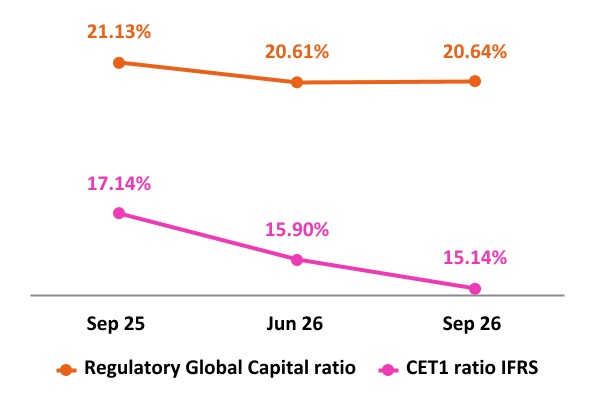
At the end of 3Q26, the IFRS CET 1 at Mibanco stood at 15.14% (-76 bps QoQ), which was above our internal appetite of 15%. QoQ. The decline this quarter was attributable to an uptick in credit RWAs, which rose on the back of loan growth. This result was partially offset by an uptick in Retained Earnings, which was driven by business expansion. YoY, the ratio fell -201 bps. This reduction was fueled by growth in RWAs- which was driven by the same dynamics that drove the QoQ result-, and was offset by an uptick in total results and in the Capital and Reserves level, which rose on the back of earnings capitalization.
Under the parameters of current regulation, the local CET 1 ratio stood at 15.63%, which compares favorably with the minimum requirement of 8.38% at the end of September 2026. The Regulatory Global Capital Ratio stood at 20.64% (+3 bps QoQ), at quarter-end, which remains comfortably above the minimum of 15.26% required by the regulator.
41
| | | Earnings Release 3Q / 2026 | Analysis of 3Q26 Consolidated Results | ||||||||
11 | Economic Outlook | ||||
Executive Summary
•In 3Q26, GDP is estimated to have grown around 3.3% YoY, up from 2.6% in 2Q26, mainly due to a smaller contraction in primary sectors. Meanwhile, non-primary sectors continued to expand at a solid pace close to 5% YoY.
•Inflation closed 3Q26 at 4.5% YoY (4.0% YoY in 2Q26), its highest level since September 2023, and has remained above the upper bound of the BCRP's target range (1%-3%) since March 2026. As of October 2026, the BCRP held its policy rate at 4.25% (no change over the past twelve months).
•According to BCRP, the exchange rate closed 3Q26 at PEN/USD 3.431, a depreciation of 0.6% relative to the end of 2Q26.
Peru: Economic Forecast
| Peru | 2022 | 2023 | 2024 | 2025 | 2026 (4) | 2027 (4) | ||||||||||||||
| GDP (US$ bn) | 249 | 272 | 296 | 341 | 392 | 424 | ||||||||||||||
| Real GDP (% change) | 2.8 | -0.4 | 3.5 | 3.4 | 3.2 | 3.0 | ||||||||||||||
| GDP per capita (US$) | 7,442 | 8,159 | 8,673 | 9,926 | 11,295 | 12,109 | ||||||||||||||
| Domestic demand (% change) | 2.4 | -1.0 | 4.0 | 5.8 | 5.5 | 3.5 | ||||||||||||||
| Financial system loan (% change) (1) | 9.7 | 2.8 | 1.3 | 4.4 | 10.4 | 7.0 | ||||||||||||||
| Financial system loan, FX neutral (% change) (1) | 10.9 | 3.5 | 1.0 | 7.2 | 10.5 | 7.8 | ||||||||||||||
| Inflation, end of period (2) | 8.5 | 3.2 | 2.0 | 1.5 | 5.5 | 2.5 | ||||||||||||||
| Reference Rate, end of period | 7.50 | 6.75 | 5.00 | 4.25 | 4.5 | 4.5 | ||||||||||||||
| Exchange rate, end of period | 3.81 | 3.71 | 3.76 | 3.36 | 3.35 | 3.25 | ||||||||||||||
| Exchange rate, (% change) (3) | 4.5% | 2.7% | -1.3% | 10.6% | 0.3% | 3.0% | ||||||||||||||
| Fiscal balance (% GDP) | -1.7 | -2.7 | -3.4 | -2.2 | -1.5 | -2.4 | ||||||||||||||
| Public Debt (as % GDP) | 33 | 32 | 32 | 30 | 29 | 30 | ||||||||||||||
| Trade balance (US$ bn) | 10 | 17 | 24 | 35 | 49 | 48 | ||||||||||||||
| (As % GDP) | 4.2% | 6.3% | 8.2% | 10.1% | 12.5% | 11.3% | ||||||||||||||
| Exports | 66 | 67 | 76 | 93 | 119 | 123 | ||||||||||||||
| Imports | 56 | 50 | 52 | 59 | 70 | 75 | ||||||||||||||
| Current account balance (As % GDP) | (4.0)% | 0.5% | 2.4% | 3.5% | 4.0% | 3.2% | ||||||||||||||
| Net international reserves (US$ bn) | 72 | 71 | 79 | 90 | 101 | 109 | ||||||||||||||
| (As % GDP) | 29% | 26% | 27% | 26% | 26% | 26% | ||||||||||||||
| (As months of imports) | 15 | 17 | 18 | 19 | 17 | 17 | ||||||||||||||
Source: INEI, BCRP y SBS.
(1)Financial System, Current Exchange Rate
(2)Inflation Target: 1%-3%
(3)Negative % change indicates depreciation.
(4)Grey area indicates estimates by BCP – Economic Research as of Octubre 2026.
42
| | | Earnings Release 3Q / 2026 | Analysis of 3Q26 Consolidated Results | ||||||||
11. Economic Outlook | |||||||||||
Main Macroeconomic Variables
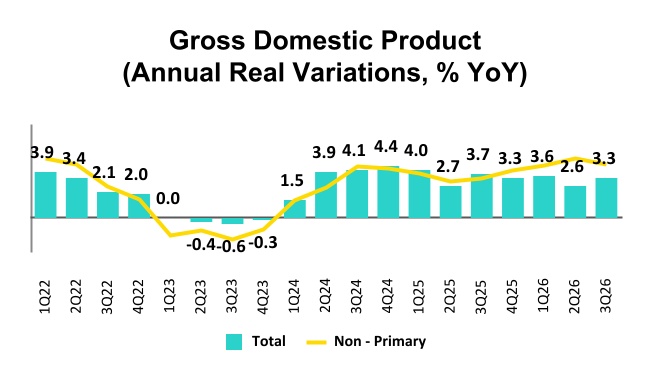
In 3Q26, GDP is estimated to have grown by around 3.3% YoY, accelerating from 2.6% in 2Q26. This result was mainly fueled by a smaller contraction in the primary sectors in 3Q26 (1.5% versus 5.2% in 2Q26), which represents the sharpest drop since 2014, excluding the pandemic. Fishing, agriculture, and primary manufacturing continued to be impacted by El Niño. Meanwhile, domestic demand is estimated to have grown above 5%, marking eight consecutive quarters of solid growth, supported by historically high terms of trade, expanding employment, and the momentum of the economic cycle. Notably, private investment has been growing at double-digit rates since 3Q25.
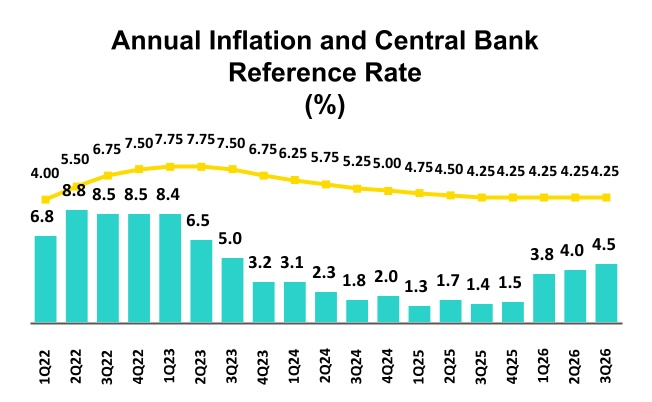
Annual inflation in Metropolitan Lima closed 3Q26 at 4.5% YoY, its highest level since September 2023, and has remained above the upper bound of the BCRP's target range (1%-3%) since March 2026. This acceleration was driven mainly by higher transportation costs, which rose on the back of an increase in international oil prices. Core inflation excluding food and energy (SAE) remained at 4.5%, its highest level since mid-2023. If we exclude transportation, SAE inflation increased from 1.6% YoY in 2Q26 to 1.8% in 3Q26, but remained below the midpoint of the target range.
In 3Q26, BCRP kept the policy rate unchanged at 4.25%. The last adjustment took place in September 2025, when the central bank cut the rate by 25 basis points.
43
| | | Earnings Release 3Q / 2026 | Analysis of 3Q26 Consolidated Results | ||||||||
11. Economic Outlook | |||||||||||
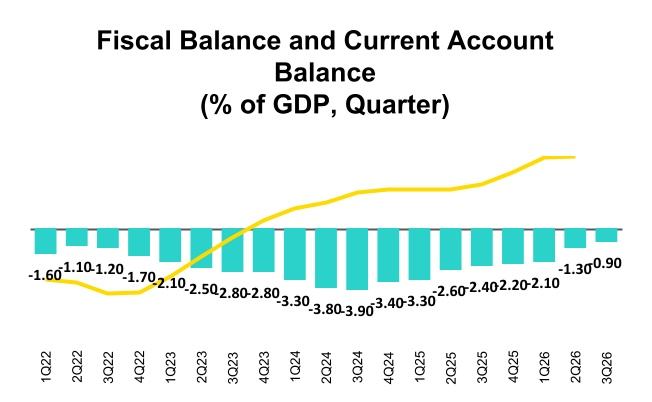
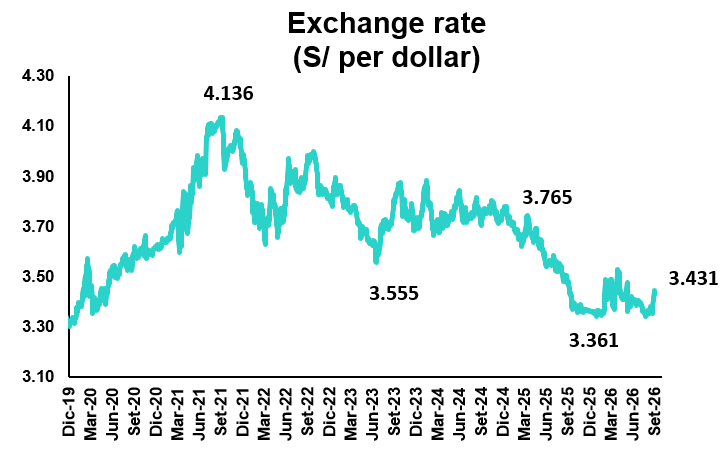
The annualized fiscal deficit narrowed to 0.9% of GDP in September 2026, its lowest level since May 2022. Fiscal revenues increased 19.7% YoY in 3Q26, supported by elevated metal prices and strong growth in domestic demand growth, while public spending rose 5.8% YoY, with current expenditure up 11.4% and gross fixed capital formation increasing 7.4%.
The credit rating agencies (Moody’s, Fitch, and S&P) made no rating actions during 3Q26. As a result, they continue to assign Peru investment-grade status with a stable outlook.
The 12-month cumulative trade balance surplus increased to USD 48 billion in August 2026, a new all-time high, driven by a 36.0% growth in exports amid elevated copper, gold, and silver prices. Imports, in turn, rose 19.0%, reflecting the strength of domestic demand and investment activity.
According to the BCRP, the exchange rate closed 3Q26 at PEN 3.431 per U.S. dollar, a 0.6% depreciation relative to the end of 2Q26 and a 2.1% depreciation compared with the end of 2025. In the final week of the quarter, the exchange rate weakened from PEN 3.354 to PEN 3.431 per U.S. dollar, a depreciation of more than 2%, reflecting the rebound in oil prices above USD 100 per barrel, higher U.S. Treasury yields, and a stronger U.S. dollar following the Fed’s decision to raise its policy rate for the first time since 2023. Net International Reserves (NIR) closed 3Q26 at USD 92.2 billion, slightly down from USD 95.6 billion at the end of 2Q26.
44
| | | Earnings Release 3Q / 2026 | Analysis of 3Q26 Consolidated Results | ||||||||
Safe Harbor for Forward-Looking Statements | |||||||||||
This material includes “forward-looking statements” within the meaning of Section 27A of the U.S. Securities Act of 1933 and Section 21E of the U.S. Securities Exchange Act of 1934. All statements other than statements of historical fact are forward-looking and may contain information about financial results, economic conditions, trends and known uncertainties. Forward-looking statements are not assurances of future performance. Instead, they are based only on our management’s current views, beliefs, expectations and assumptions regarding the future of our business, future plans and strategies, projections, anticipated events and trends, the economy and other future conditions.
Many forward-looking statements can be identified by words such as: “anticipate”, “intend”, “plan”, “goal”, “seek”, “believe”, “project”, “estimate”, “expect”, “strategy”, “future”, “likely”, “would”, “may”, “should”, “will”, “see” and similar references to future periods. Examples of forward-looking statements include, among others, statements or estimates we make regarding guidance relating to losses in our credit portfolio, efficiency ratio, provisions and non-performing loans, current or future market risk and future market conditions, expected macroeconomic events and conditions, our belief that we have sufficient capital and liquidity to fund our business operations, expectations of the effect on our financial condition of claims, legal actions, environmental costs, contingent liabilities and governmental and regulatory investigations and proceedings, strategy for customer retention, growth, governmental programs and regulatory initiatives, credit administration, product development, market position, financial results and reserves and strategy for risk management.
We caution readers that forward-looking statements involve known and unknown risks and uncertainties that could cause actual results, performance, or events to differ materially from those that we expect or that are expressed or implied in the forward-looking statements, depending on the outcome of certain factors, including, without limitation, adverse changes in:
•The occurrence of natural disasters or political or social instability in Peru;
•The adequacy of the dividends that our subsidiaries are able to pay to us, which may affect our ability to pay dividends to shareholders and corporate expenses;
•Performance of, and volatility in, financial markets, including Latin-American and other markets;
•The frequency, severity and types of insured loss events;
•Fluctuations in interest rate levels;
•Foreign currency exchange rates, including the Sol/US Dollar exchange rate;
•Deterioration in the quality of our loan portfolio;
•Increasing levels of competition in Peru and other markets in which we operate;
•Developments and changes in laws and regulations affecting the financial sector and adoption of new international guidelines;
•Changes in the policies of central banks and/or foreign governments;
•Effectiveness of our risk management policies and of our operational and security systems;
•Losses associated with counterparty exposures;
•The scope of the coronavirus (“COVID-19”) outbreak, actions taken to contain the COVID-19 and related economic effects from such actions and our ability to maintain adequate staffing; and
•Changes in Bermuda laws and regulations applicable to so-called non-resident entities.
See “Item 3. Key Information—3. D Risk Factors” and “Item 5. Operating and Financial Review and Prospects” in our most recent Annual Report on Form 20-F filed with the U.S. Securities and Exchange Commission for additional information and other such factors. You are cautioned not to place undue reliance on these forward-looking statements, which speak only as of the date hereof and are based only on information currently available to us. Therefore, you should not rely on any of these forward-looking statements.
We undertake no obligation to publicly update or revise these or any other forward-looking statements that may be made to reflect events or circumstances after the date hereof, whether as a result of changes in our business strategy or new information, to reflect the occurrence of unanticipated events or otherwise.
45
| | | Earnings Release 3Q / 2026 | Analysis of 3Q26 Consolidated Results | ||||||||
12 | Appendix | ||||
12.6. Regulatory Capital | |||||
46
| | | Earnings Release 3Q / 2026 | Analysis of 3Q26 Consolidated Results | ||||||||
12. Appendix | |||||||||||
12.1.Evolution of Loans in Average Daily Balances
Total Loans (in Average Daily Balances) (1)(2)
Total Loans (S/ millions) | As of | Volume change | % change | % Part. in total loans | ||||||||||||||||||||||||||||
| Sep 25 | Jun 26 | Sep 26 | QoQ | YoY | QoQ | YoY | Sep 25 | Jun 26 | Sep 26 | |||||||||||||||||||||||
| BCP Stand-alone | 121,189 | 131,365 | 135,994 | 4,630 | 14,805 | 3.5% | 12.2% | 82.6% | 83.2% | 84.7% | ||||||||||||||||||||||
| Wholesale Banking | 54,645 | 58,825 | 59,937 | 1,112 | 5,291 | 1.9% | 9.7% | 37.2% | 37.3% | 37.3% | ||||||||||||||||||||||
| Corporate | 32,544 | 34,977 | 34,951 | -26 | 2,407 | -0.1% | 7.4% | 22.2% | 22.2% | 21.8% | ||||||||||||||||||||||
| Middle - Market | 22,101 | 23,848 | 24,985 | 1,138 | 2,884 | 4.8% | 13.0% | 15.1% | 15.1% | 15.6% | ||||||||||||||||||||||
| Retail Banking | 66,544 | 72,540 | 76,058 | 3,518 | 9,514 | 4.8% | 14.3% | 45.4% | 46.0% | 47.4% | ||||||||||||||||||||||
| SME - Business | 7,751 | 7,152 | 7,658 | 506 | -94 | 7.1% | -1.2% | 5.3% | 4.5% | 4.8% | ||||||||||||||||||||||
| SME - Pyme | 16,193 | 17,720 | 18,738 | 1,018 | 2,545 | 5.7% | 15.7% | 11.0% | 11.2% | 11.7% | ||||||||||||||||||||||
| Mortgage | 22,986 | 24,604 | 25,236 | 632 | 2,250 | 2.6% | 9.8% | 15.7% | 15.6% | 15.7% | ||||||||||||||||||||||
| Consumer | 13,511 | 16,509 | 17,561 | 1,052 | 4,050 | 6.4% | 30.0% | 9.2% | 10.5% | 10.9% | ||||||||||||||||||||||
| Credit Card | 6,102 | 6,555 | 6,865 | 310 | 763 | 4.7% | 12.5% | 4.2% | 4.2% | 4.3% | ||||||||||||||||||||||
| Mibanco | 12,734 | 14,124 | 14,855 | 730 | 2,121 | 5.2% | 16.7% | 8.7% | 8.9% | 9.3% | ||||||||||||||||||||||
| Mibanco Colombia | 2,004 | 2,681 | 3,172 | 491 | 1,168 | 18.3% | 58.3% | 1.4% | 1.7% | 2.0% | ||||||||||||||||||||||
| Bolivia | 9,363 | 8,343 | 5,162 | -3,181 | -4,201 | -38.1% | -44.9% | 6.4% | 5.3% | 3.2% | ||||||||||||||||||||||
| ASB Bank Corp. | 1,431 | 1,354 | 1,336 | -18 | -94 | -1.3% | -6.6% | 1.0% | 0.9% | 0.8% | ||||||||||||||||||||||
| BAP's total loans | 146,720 | 157,866 | 160,519 | 2,653 | 13,799 | 1.7% | 9.4% | 100.0% | 100.0% | 100.0% | ||||||||||||||||||||||
For consolidation purposes. Loans generated in Foreign Currency (FC) are converted into Local Currency (LC). | ____ | Larger contraction in volume | ||||||
| (1) Includes Special accounts, and other banking. | ____ | Larger expansion in volume | ||||||
| (2) Portfolio Management Figures. Non-audited figures. | ||||||||
12.2.Loan Portfolio Quality
Portfolio Quality Ratios by Segment
Wholesale Banking
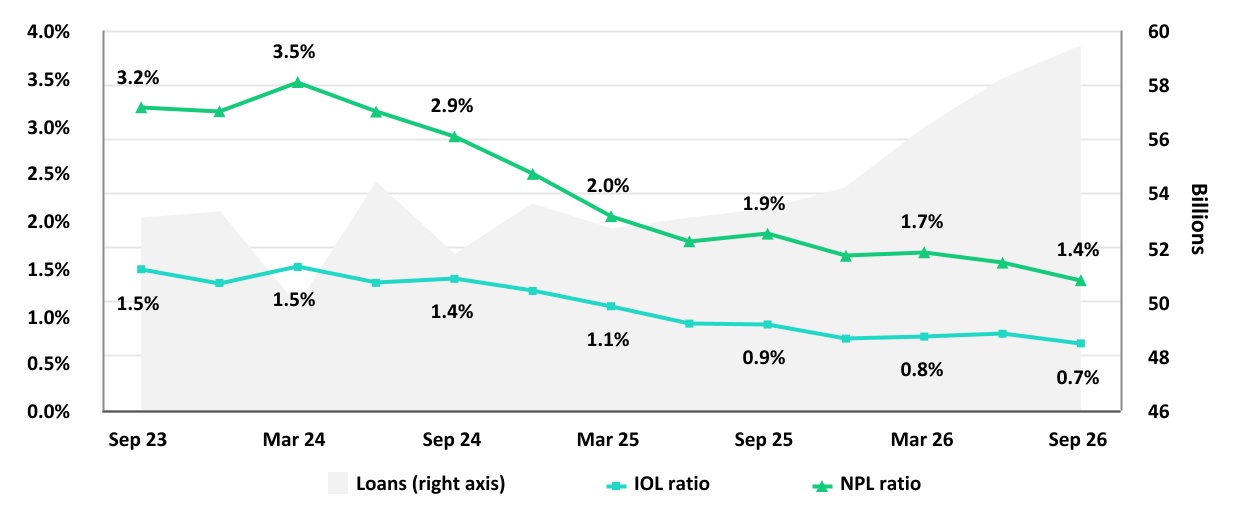
47
| | | Earnings Release 3Q / 2026 | Analysis of 3Q26 Consolidated Results | ||||||||
12. Appendix | |||||||||||
SME-Business
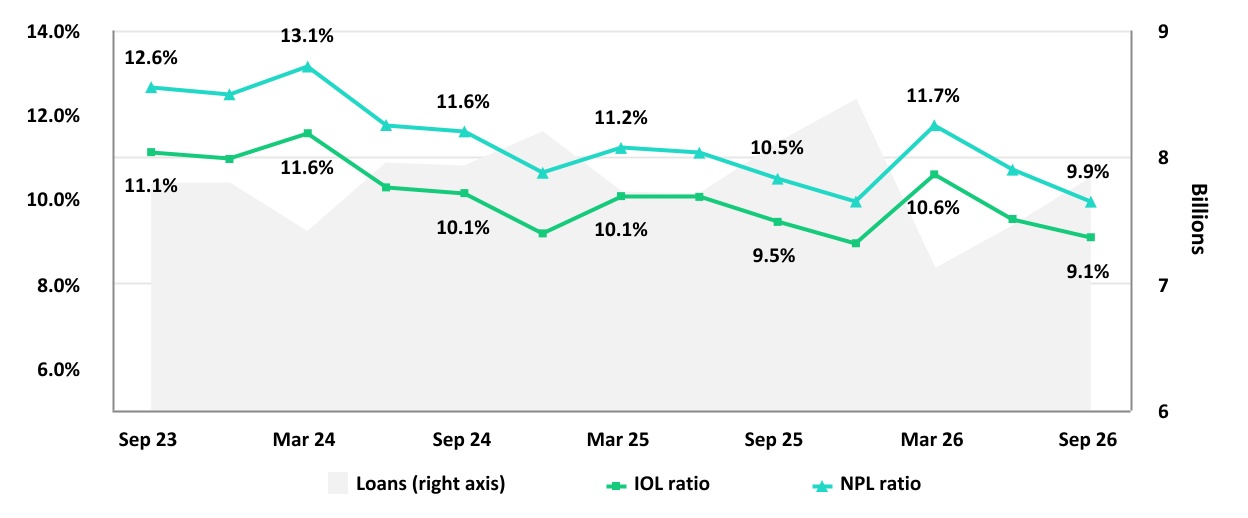
SME-Pyme
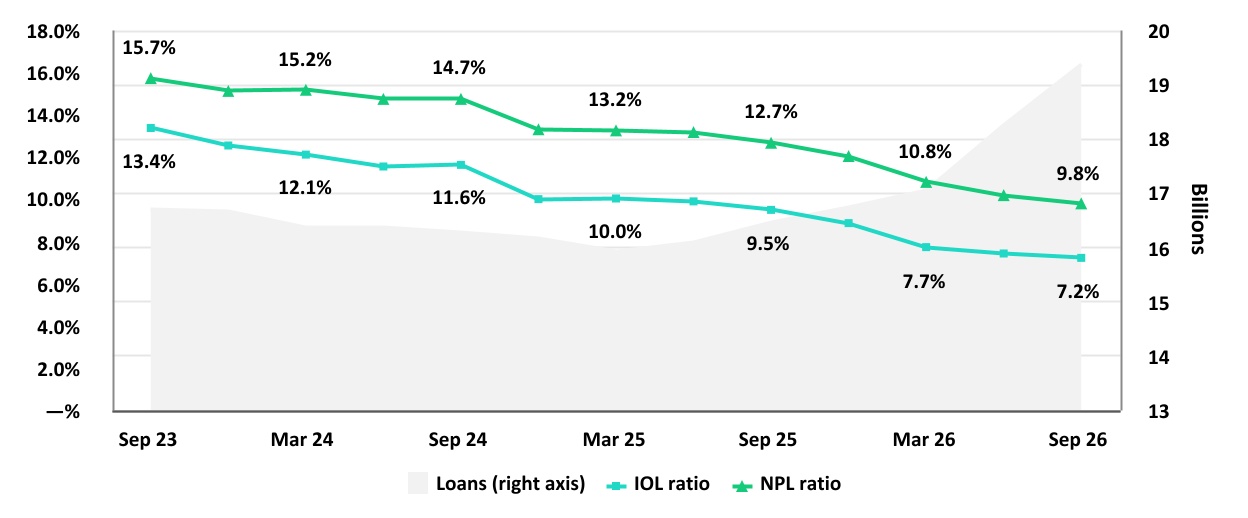
48
| | | Earnings Release 3Q / 2026 | Analysis of 3Q26 Consolidated Results | ||||||||
12. Appendix | |||||||||||
Mortgage
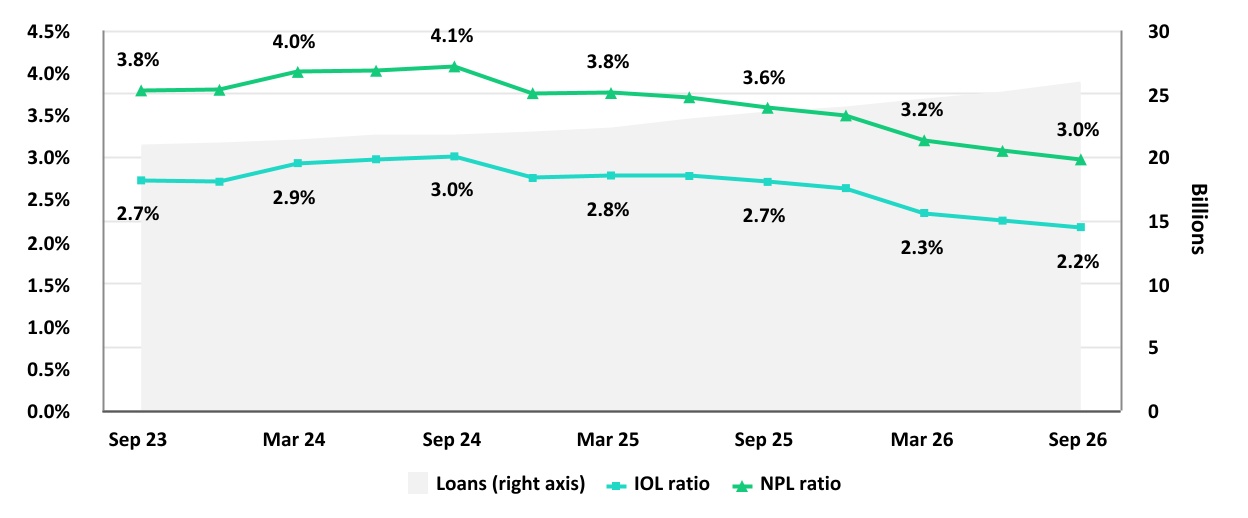
Consumer
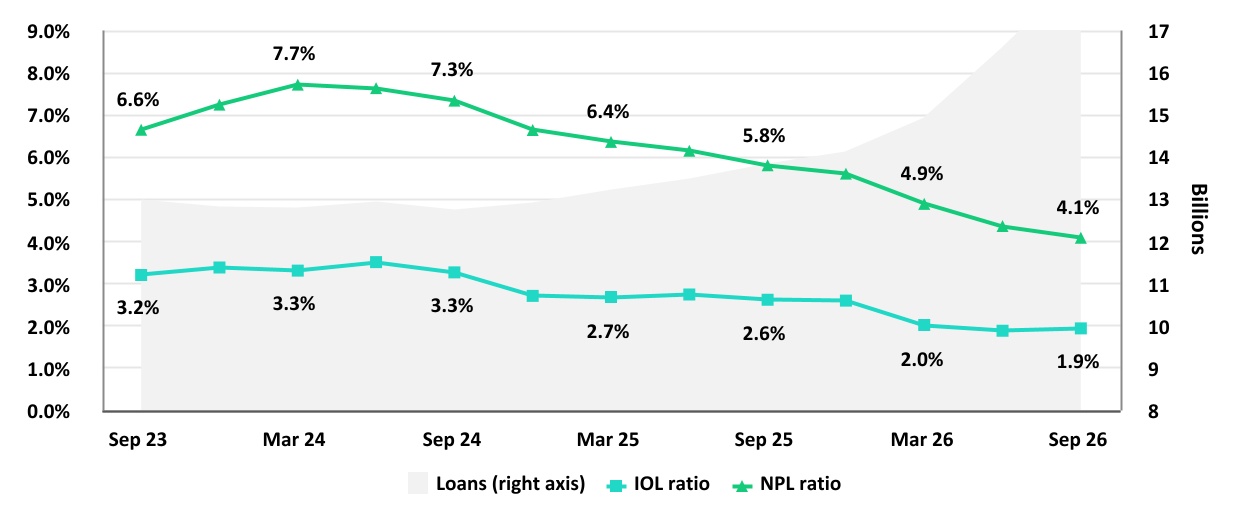
Credit Cards
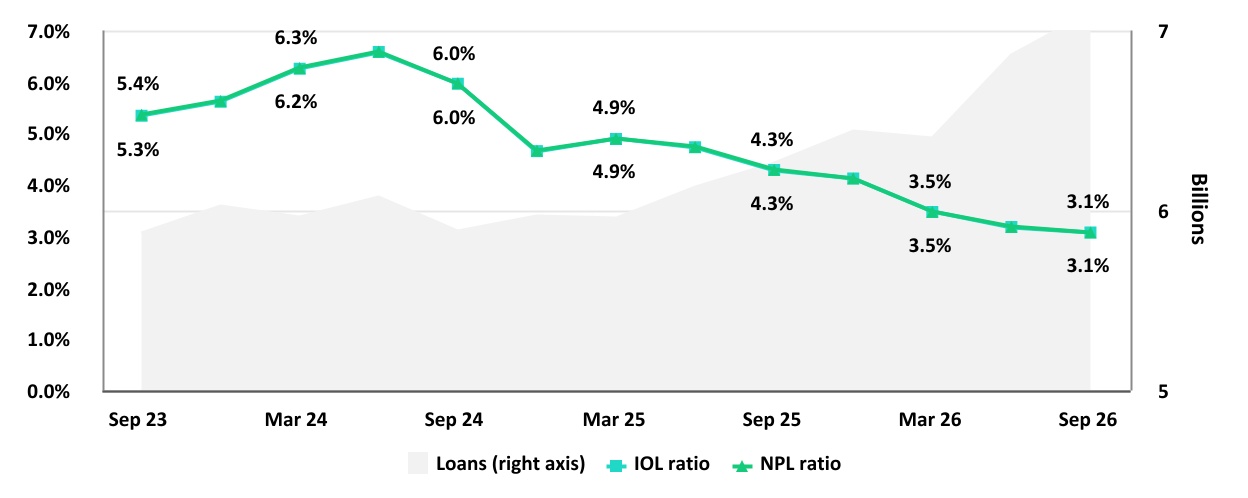
49
| | | Earnings Release 3Q / 2026 | Analysis of 3Q26 Consolidated Results | ||||||||
12. Appendix | |||||||||||
Mibanco
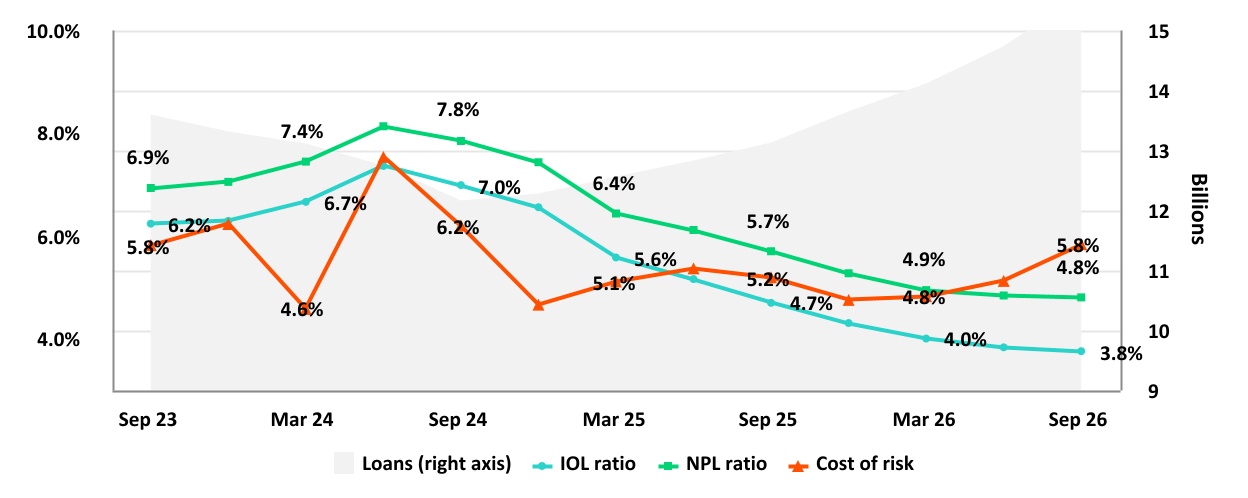
BCP Bolivia
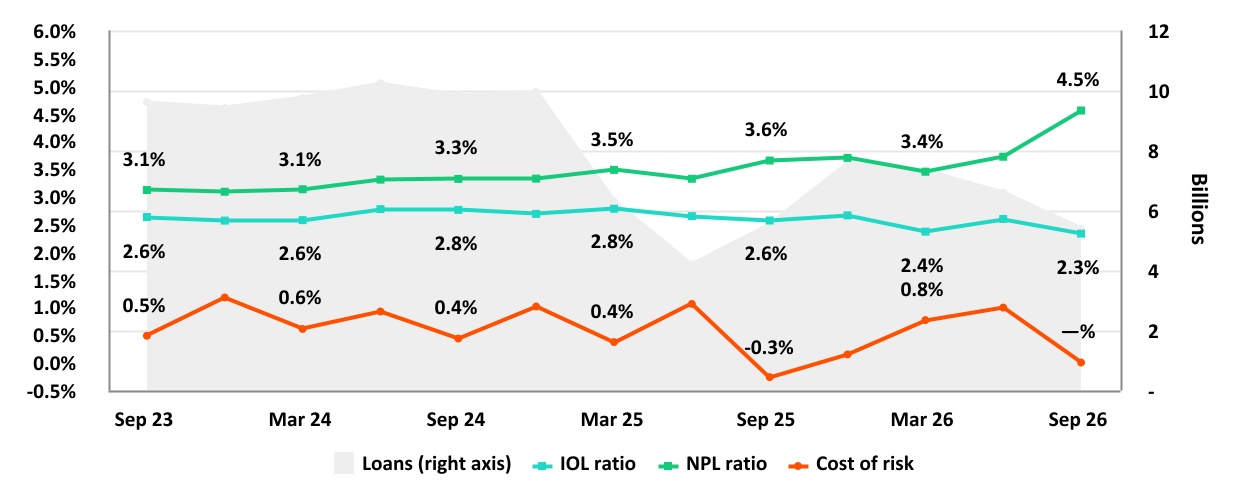
50
| | | Earnings Release 3Q / 2026 | Analysis of 3Q26 Consolidated Results | ||||||||
12. Appendix | |||||||||||
12.3.Net Interest Income (NII)
NII Summary
Net interest income | Quarter | % Change | Up to | % Change | ||||||||||||||||||||||
S/000 | 3Q25 | 2Q26 | 3Q26 | QoQ | YoY | Sep 25 | Sep 26 | Sep 26 / Sep 25 | ||||||||||||||||||
Interest income | 4,987,693 | 5,413,885 | 5,717,687 | 5.6% | 14.6% | 14,804,775 | 16,343,984 | 10.4% | ||||||||||||||||||
Interest on loans | 3,960,980 | 4,370,700 | 4,664,670 | 6.7% | 17.8% | 11,649,345 | 13,178,183 | 13.1% | ||||||||||||||||||
Dividends on investments | 19,179 | 24,891 | 29,518 | 18.6% | 53.9% | 67,211 | 71,401 | 6.2% | ||||||||||||||||||
Interest on deposits with banks | 316,420 | 321,152 | 271,330 | -15.5% | -14.3% | 1,003,365 | 914,054 | -8.9% | ||||||||||||||||||
Interest on securities | 623,216 | 674,434 | 729,019 | 8.1% | 17.0% | 1,928,274 | 2,112,686 | 9.6% | ||||||||||||||||||
Other interest income | 67,898 | 22,708 | 23,150 | 1.9% | -65.9% | 156,580 | 67,660 | -56.8% | ||||||||||||||||||
Interest expense | 1,299,864 | 1,316,934 | 1,376,563 | 4.5% | 5.9% | 3,929,563 | 3,943,182 | 0.3% | ||||||||||||||||||
Interest expense (excluding Net Insurance Financial Expenses) | 1,158,420 | 1,147,859 | 1,208,903 | 5.3% | 4.4% | 3,513,442 | 3,443,529 | -2.0% | ||||||||||||||||||
Interest on deposits | 565,344 | 565,502 | 601,787 | 6.4% | 6.4% | 1,725,971 | 1,706,617 | -1.1% | ||||||||||||||||||
Interest on borrowed funds | 252,490 | 224,381 | 231,864 | 3.3% | -8.2% | 784,402 | 667,044 | -15.0% | ||||||||||||||||||
Interest on bonds and subordinated notes | 164,653 | 195,051 | 193,611 | -0.7% | 17.6% | 525,802 | 577,028 | 9.7% | ||||||||||||||||||
Other interest expense | 175,933 | 162,925 | 181,641 | 11.5% | 3.2% | 477,267 | 492,840 | 3.3% | ||||||||||||||||||
Net Insurance Financial Expenses | 141,444 | 169,075 | 167,660 | -0.8% | 18.5% | 416,121 | 499,653 | 20.1% | ||||||||||||||||||
Net interest, similar income and expenses | 3,687,829 | 4,096,951 | 4,341,124 | 6.0% | 17.7% | 10,875,212 | 12,400,802 | 14.0% | ||||||||||||||||||
Provision for credit losses on loan portfolio, net of recoveries | 602,918 | 731,208 | 828,136 | 13.3% | 37.4% | 1,759,970 | 2,041,432 | 16.0% | ||||||||||||||||||
Net interest, similar income and expenses, after provision for credit losses on loan portfolio | 3,084,911 | 3,365,743 | 3,512,988 | 4.4% | 13.9% | 9,115,242 | 10,359,370 | 13.6% | ||||||||||||||||||
Average interest earning assets | 233,285,291 | 257,562,678 | 260,119,720 | 1.0% | 11.5% | 237,958,451 | 253,498,885 | 6.5% | ||||||||||||||||||
Net interest margin (1) | 6.57% | 6.63% | 6.93% | 30 bps | 36 bps | 6.33% | 6.79% | 46 bps | ||||||||||||||||||
Risk-adjusted Net interest margin (1) | 5.53% | 5.49% | 5.66% | 17 bps | 13 bps | 5.34% | 5.71% | 37 bps | ||||||||||||||||||
Net provisions for loan losses / Net interest income (1) | 16.35% | 17.85% | 19.08% | 123 bps | 273 bps | 16.18% | 16.46% | 28 bps | ||||||||||||||||||
(1)Annualized. For further detail on the NIM calculation due to IFRS17, please refer to Annex 12.8.
12.4.Net Interest Margin (NIM) and Risk-Adjusted NIM by Subsidiary
| NIM Breakdown | 3Q25 | 2Q26 | 3Q26 | ||||||||
| BCP | 6.11% | 6.13% | 6.39% | ||||||||
| Mibanco | 15.02% | 15.15% | 15.31% | ||||||||
| BCP Bolivia | 3.21% | 2.94% | 3.75% | ||||||||
| Credicorp | 6.57% | 6.63% | 6.93% | ||||||||
NIM: Annualized Net interest income (excluding Net Insurance Financial Expenses) / Average period end and period
beginning interest-earning assets.
| Risk Adjusted NIM Breakdown | 3Q25 | 2Q26 | 3Q26 | ||||||||
| BCP | 5.25% | 5.18% | 5.32% | ||||||||
| Mibanco | 11.03% | 11.21% | 10.71% | ||||||||
| BCP Bolivia | 3.45% | 2.18% | 3.75% | ||||||||
| Credicorp | 5.53% | 5.49% | 5.66% | ||||||||
Risk-Adjusted NIM: (Annualized Net interest income (excluding Net Insurance Financial Expenses) - annualized provisions) / Average
period end and period beginning interest-earning assets.
51
| | | Earnings Release 3Q / 2026 | Analysis of 3Q26 Consolidated Results | ||||||||
12. Appendix | |||||||||||
12.5. Physical Points of contact
Physical Point of Contact (1) | As of | Change (units) | |||||||||||||||
(Units) | Sep 25 | Jun 26 | Sep 26 | QoQ | YoY | ||||||||||||
Branches (2) | 646 | 648 | 648 | - | 2 | ||||||||||||
| ATMs | 2,723 | 2,622 | 2,497 | (125) | (226) | ||||||||||||
| Agents | 12,644 | 11,667 | 11,307 | (360) | (1,337) | ||||||||||||
| Total | 16,013 | 14,937 | 14,452 | (485) | (1,561) | ||||||||||||
(1)Includes Physical Point of Contact of BCP Stand-Alone, Mibanco Peru and BCP Bolivia
(2)Includes Banco de la Nacion branches.
12.6. Regulatory Capital
Regulatory Capital and Capital Adequacy Ratios
(IFRS)
| Regulatory Capital and Capital Adequacy Ratios | As of | % Change | |||||||||||||||
| S/000 | Sep 25 | Jun 26 | Sep 26 | QoQ | YoY | ||||||||||||
| Capital Stock | 1,318,993 | 1,318,993 | 1,318,993 | — | — | ||||||||||||
| Treasury Stocks | (209,845) | (209,106) | (209,106) | —% | -0.4% | ||||||||||||
| Capital Surplus | 139,527 | 86,146 | 84,273 | -2.2% | -39.6% | ||||||||||||
| Legal and Other Capital reserves | 29,628,427 | 32,540,118 | 32,577,140 | 0.1% | 10.0% | ||||||||||||
| Minority interest | 475,729 | 476,717 | 477,112 | 0.1% | 0.3% | ||||||||||||
| Current and Accumulated Earnings (1) | 6,737,239 | 4,229,425 | 6,203,331 | 46.7% | -7.9% | ||||||||||||
| Unrealized Gains or Losses (2) | 392,256 | 179,202 | (627,628) | n.a. | n.a. | ||||||||||||
| Goodwill | (1,290,496) | (1,271,630) | (1,276,599) | 0.4% | -1.1% | ||||||||||||
| Intangible Assets (3) | (3,345,228) | (3,813,805) | (3,903,003) | 2.3% | 16.7% | ||||||||||||
| Deductions in Common Equity Tier 1 instruments (4) | (81,609) | (59,128) | (43,433) | -26.5% | -46.8% | ||||||||||||
| Subordinated Debt | 7,246,406 | 9,911,662 | 8,385,721 | -15.4% | 15.7% | ||||||||||||
| Loan loss reserves (5) | 2,036,080 | 2,243,247 | 2,311,264 | 3.0% | 13.5% | ||||||||||||
| Deductions in Tier 2 instruments (6) | (1,438,739) | (1,323,617) | (847,156) | -36.0% | -41.1% | ||||||||||||
| Total Regulatory Capital (A) | 41,608,741 | 44,308,224 | 44,450,909 | 0.3% | 6.8% | ||||||||||||
| Total Regulatory Common Equity Tier 1 Capital (B) | 33,764,993 | 33,476,932 | 34,601,080 | 3.4% | 2.5% | ||||||||||||
| Total Regulatory Tier 1 Capital (C) | 33,764,993 | 33,476,932 | 34,601,080 | 3.4% | 2.5% | ||||||||||||
| Total Regulatory Capital Requirement (D) | 30,993,862 | 35,232,602 | 36,187,896 | 2.7% | 16.8% | ||||||||||||
| Total Regulatory Common Equity Tier 1 Capital Requirement (E) | 16,281,634 | 19,163,321 | 19,714,428 | 2.9% | 21.1% | ||||||||||||
| Total Regulatory Tier 1 Capital Requirement (F) | 19,727,355 | 22,964,372 | 23,605,210 | 2.8% | 19.7% | ||||||||||||
| Regulatory Capital Ratio (A) / (D) | 134% | 126% | 123% | -293 bps | -1141 bps | ||||||||||||
| Regulatory Common Equity Tier 1 Capital Ratio (B) / (E) | 207% | 175% | 176% | 82 bps | -3187 bps | ||||||||||||
| Regulatory Tier 1 Capital Ratio (C) / (F) | 171% | 146% | 147% | 80 bps | -2458 bps | ||||||||||||
(1)Earnings include Banco de Crédito del Perú and Mibanco Perú. Losses include all subsidiaries.
(2)Gains include Investment Grade Government Bonds and Peruvian Central Bank Certificates of Deposits. Losses include all bonds.
(3)Different to Goodwill. Includes Deferred Tax Assets.
(4)Investments in Equity.
(5)Up to 1.25% of total risk-weighted assets of Banco de Crédito del Perú, Solución Empresa Administradora Hipotecaria, Mibanco and Atlantic Security Bank.
(6)Investments in Tier 2 Subordinated Debt.
52
| | | Earnings Release 3Q / 2026 | Analysis of 3Q26 Consolidated Results | ||||||||
12. Appendix | |||||||||||
Regulatory and Capital Adequacy Ratios at BCP Stand-alone
| Regulatory Capital | As of | % Change | |||||||||||||||
(S/ thousand) | Sep 25 | Jun 26 | Sep 26 | QoQ | YoY | ||||||||||||
| Capital Stock | 12,973,175 | 12,973,175 | 12,973,175 | 0.0% | 0.0% | ||||||||||||
| Reserves | 6,125,452 | 6,126,836 | 6,126,836 | 0.0% | 0.0% | ||||||||||||
| Accumulated earnings | 6,730,631 | 6,695,102 | 8,563,230 | 27.9% | 27.2% | ||||||||||||
Loan loss reserves (1) | 1,800,868 | 1,978,395 | 2,045,475 | 3.4% | 13.6% | ||||||||||||
| Subordinated Debt | 6,419,500 | 8,866,000 | 7,209,300 | -18.7% | 12.3% | ||||||||||||
| Unrealized Profit or Losses | (10,363) | 6,475 | (413,704) | -6,489.4% | 3,891.9% | ||||||||||||
| Investment in subsidiaries and others, net of unrealized profit and net income in subsidiaries | (2,535,672) | (2,731,362) | (2,791,776) | 2.2% | 10.1% | ||||||||||||
| Intangibles | (1,624,042) | (1,882,535) | (1,998,801) | 6.2% | 23.1% | ||||||||||||
| Goodwill | (122,083) | (122,083) | (122,083) | 0.0% | 0.0% | ||||||||||||
| Total Regulatory Capital | 29,757,465 | 31,910,002 | 31,591,651 | -1.0% | 6.2% | ||||||||||||
Tier 1 Common Equity (2) | 21,537,097 | 21,065,607 | 22,336,876 | 6.0% | 3.7% | ||||||||||||
Regulatory Tier 1 Capital (3) | 21,537,097 | 21,065,607 | 22,336,876 | 6.0% | 3.7% | ||||||||||||
Regulatory Tier 2 Capital (4) | 8,220,368 | 10,844,395 | 9,254,775 | -14.7% | 12.6% | ||||||||||||
| Total risk-weighted assets | As of | % Change | |||||||||||||||
(S/ thousand) | Sep 25 | Jun 26 | Sep 26 | QoQ | YoY | ||||||||||||
| Market risk-weighted assets | 5,329,045 | 6,454,270 | 6,709,359 | 4.0% | 25.9% | ||||||||||||
| Credit risk-weighted assets | 142,895,450 | 157,205,076 | 162,643,567 | 3.5% | 13.8% | ||||||||||||
| Operational risk-weighted assets | 19,751,032 | 21,104,548 | 21,697,606 | 2.8% | 9.9% | ||||||||||||
| Total | 167,975,527 | 184,763,894 | 191,050,533 | 3.4% | 13.7% | ||||||||||||
| Capital requirement | As of | % Change | |||||||||||||||
(S/ thousand) | Sep 25 | Jun 26 | Sep 26 | QoQ | YoY | ||||||||||||
| Market risk capital requirement | 532,904 | 645,427 | 670,936 | 4.0% | 25.9% | ||||||||||||
| Credit risk capital requirement | 14,289,545 | 15,720,508 | 16,264,357 | 3.5% | 13.8% | ||||||||||||
| Operational risk capital requirement | 1,975,103 | 2,110,455 | 2,169,761 | 2.8% | 9.9% | ||||||||||||
| Additional capital requirements | 7,348,282 | 9,075,931 | 9,380,954 | 3.4% | 27.7% | ||||||||||||
| Total | 24,145,835 | 27,552,320 | 28,486,007 | 3.4% | 18.0% | ||||||||||||
Capital Ratios under Local Regulation
| Capital ratios under Local Regulation | As of | % Change | |||||||||||||||
| Sep 25 | Jun 26 | Sep 26 | QoQ | YoY | |||||||||||||
| Common Equity Tier 1 ratio | 12.82% | 11.40% | 11.69% | 29 bps | -113 bps | ||||||||||||
| Tier 1 Capital ratio | 12.82% | 11.40% | 11.69% | 29 bps | -113 bps | ||||||||||||
| Regulatory Global Capital ratio | 17.72% | 17.27% | 16.54% | -73 bps | -118 bps | ||||||||||||
[1]Up to 1.25% of total risk-weighted assets.
[2]Common Equity Tier 1 = Capital Stock + Reserves + Accumulated earnings – Unrealized profits or losses - 100% deductions (investment in subsidiaries, goodwill, intangible assets and deferred tax assets based on future returns).
[3]Regulatory Tier 1 Capital = Common Equity Tier 1 + Tier 1 Subordinated Debt (Perpetual).
[4]Regulatory Tier 2 Capital = Subordinated Debt + Loan loss reserves.
53
| | | Earnings Release 3Q / 2026 | Analysis of 3Q26 Consolidated Results | ||||||||
12. Appendix | |||||||||||
Regulatory Capital and Capital Adequacy Ratios at Mibanco
| Regulatory Capital | As of | % Change | |||||||||||||||
(S/ thousand) | Sep 25 | Jun 26 | Sep 26 | QoQ | YoY | ||||||||||||
| Capital Stock | 1,840,606 | 1,840,606 | 1,840,606 | 0.0% | 0.0% | ||||||||||||
| Reserves | 365,847 | 420,856 | 420,856 | 0.0% | 15.0% | ||||||||||||
| Accumulated earnings | 394,428 | 544,583 | 623,221 | 14.4% | 58.0% | ||||||||||||
Loan loss reserves (1) | 158,725 | 181,634 | 193,597 | 6.6% | 22.0% | ||||||||||||
| Subordinated debt | 388,551 | 483,217 | 633,217 | 31.0% | 63.0% | ||||||||||||
| Unrealized Profit or Losses | 7,294 | 3,870 | (5,478) | -241.5% | -175.1% | ||||||||||||
| Investment in subsidiaries and others, net of unrealized profit and net income in subsidiaries | (164) | (208) | (187) | -10.1% | 14.3% | ||||||||||||
| Intangibles | (124,978) | (143,742) | (165,852) | 15.4% | 32.7% | ||||||||||||
| Goodwill | (139,180) | (139,180) | (139,180) | 0.0% | 0.0% | ||||||||||||
| Total Regulatory Capital | 2,891,129 | 3,191,635 | 3,400,800 | 6.6% | 17.6% | ||||||||||||
Tier Common Equity (2) | 2,343,853 | 2,526,785 | 2,573,986 | 1.9% | 9.8% | ||||||||||||
Regulatory Tier 1 Capital (3) | 2,343,853 | 2,526,785 | 2,573,986 | 1.9% | 9.8% | ||||||||||||
Regulatory Tier 2 Capital (4) | 547,276 | 664,851 | 826,814 | 24.4% | 51.1% | ||||||||||||
| Total risk-weighted assets | As of | % Change | |||||||||||||||
(S/ thousand) | Sep 25 | Jun 26 | Sep 26 | QoQ | YoY | ||||||||||||
| Market risk-weighted assets | 221,008 | 183,255 | 230,560 | 25.8% | 4.3% | ||||||||||||
| Credit risk-weighted assets | 12,539,729 | 14,341,675 | 15,262,568 | 6.4% | 21.7% | ||||||||||||
| Operational risk-weighted assets | 922,672 | 958,926 | 980,188 | 2.2% | 6.2% | ||||||||||||
| Total | 13,683,410 | 15,483,857 | 16,473,316 | 6.4% | 20.4% | ||||||||||||
| Capital requirement | As of | % Change | |||||||||||||||
(S/ thousand) | Sep 25 | Jun 26 | Sep 26 | QoQ | YoY | ||||||||||||
| Market risk capital requirement | 22,101 | 18,326 | 23,056 | 25.8% | 4.3% | ||||||||||||
| Credit risk capital requirement | 1,253,973 | 1,434,168 | 1,526,257 | 6.4% | 21.7% | ||||||||||||
| Operational risk capital requirement | 92,267 | 95,893 | 98,019 | 2.2% | 6.2% | ||||||||||||
| Additional capital requirements | 188,096 | 215,125 | 228,939 | 6.4% | 21.7% | ||||||||||||
| Total | 1,556,437 | 1,763,511 | 1,876,271 | 6.4% | 20.5% | ||||||||||||
Capital Ratios under Local Regulation
| Capital ratios under Local Regulation | As of | % Change | |||||||||||||||
| Sep 25 | Jun 26 | Sep 26 | QoQ | YoY | |||||||||||||
Common Equity Tier 1 Ratio | 17.13% | 16.32% | 15.63% | -69 bps | -150 bps | ||||||||||||
| Tier 1 Capital ratio | 17.13% | 16.32% | 15.63% | -69 bps | -150 bps | ||||||||||||
| Regulatory Global Capital Ratio | 21.13% | 20.61% | 20.64% | 3 bps | -48 bps | ||||||||||||
[1]Up to 1.25% of total risk-weighted assets.
[2]Common Equity Tier 1 = Capital Stock + Reserves + Accumulated earnings – Unrealized profits or losses - 100% deductions (investment in subsidiaries, goodwill, intangible assets and deferred tax assets based on future returns).
[3]Regulatory Tier 1 Capital = Common Equity Tier 1 + Tier 1 Subordinated Debt (Perpetual).
[4]Regulatory Tier 2 Capital = Subordinated Debt + Loan loss reserves.
54
| | | Earnings Release 3Q / 2026 | Analysis of 3Q26 Consolidated Results | ||||||||
12. Appendix | |||||||||||
Common Equity Tier 1 IFRS
BCP Stand-alone
| Common Equity Tier 1 IFRS | As of | % Change | |||||||||||||||
| (S/ thousand) | Sep 25 | Jun 26 | Sep 26 | QoQ | YoY | ||||||||||||
| Capital and reserves | 18,586,384 | 18,587,768 | 18,587,768 | 0.0% | 0.0% | ||||||||||||
| Retained earnings | 7,524,062 | 7,399,221 | 9,206,522 | 24.4% | 22.4% | ||||||||||||
| Unrealized gains (losses) | 505,339 | 435,898 | (47,698) | -110.9% | -109.4% | ||||||||||||
| Goodwill and intangibles | (1,806,698) | (2,045,408) | (2,161,232) | 5.7% | 19.6% | ||||||||||||
| Investments in subsidiaries | (2,585,795) | (2,699,950) | (2,743,947) | 1.6% | 6.1% | ||||||||||||
| Total | 22,223,292 | 21,677,528 | 22,841,414 | 5.4% | 2.8% | ||||||||||||
| Adjusted RWAs IFRS | 168,714,799 | 185,328,096 | 191,562,642 | 3.4% | 13.5% | ||||||||||||
| Adjusted Credit RWAs IFRS | 143,634,722 | 157,769,277 | 163,155,676 | 3.4% | 13.6% | ||||||||||||
| Others | 25,080,077 | 27,558,818 | 28,406,966 | 3.1% | 13.3% | ||||||||||||
| CET1 ratio IFRS | 13.17% | 11.70% | 11.92% | 23 bps | -125 bps | ||||||||||||
Mibanco
| Common Equity Tier 1 IFRS | As of | % Change | |||||||||||||||
| (S/ thousand) | Sep 25 | Jun 26 | Sep 26 | QoQ | YoY | ||||||||||||
| Capital and reserves | 2,734,582 | 2,789,591 | 2,789,591 | 0.0% | 2.0% | ||||||||||||
| Retained earnings | (80,674) | (16,167) | 43,428 | -368.6% | -153.8% | ||||||||||||
| Unrealized gains (losses) | 7,100 | 5,086 | (1,932) | -138.0% | -127.2% | ||||||||||||
| Goodwill and intangibles | (296,196) | (311,455) | (333,126) | 7.0% | 12.5% | ||||||||||||
| Investments in subsidiaries | (171) | (205) | (198) | -3.2% | 16.1% | ||||||||||||
| Total | 2,364,642 | 2,466,852 | 2,497,763 | 1.3% | 5.6% | ||||||||||||
| Adjusted RWAs IFRS | 13,792,869 | 15,513,018 | 16,500,506 | 6.4% | 19.6% | ||||||||||||
| Adjusted Credit RWAs IFRS | 12,649,188 | 14,370,837 | 15,289,758 | 6.4% | 20.9% | ||||||||||||
| Others | 1,143,680 | 1,142,182 | 1,210,748 | 6.0% | 5.9% | ||||||||||||
| CET1 ratio IFRS | 17.14% | 15.90% | 15.14% | -76 bps | -201 bps | ||||||||||||
55
| | | Earnings Release 3Q / 2026 | Analysis of 3Q26 Consolidated Results | ||||||||
12. Appendix | |||||||||||
12.7. Financial Statements and Ratios by Business
12.7.1. Credicorp Consolidated
Consolidated Statement of Financial Position
(S/ Thousands, IFRS)
| As of | % Change | ||||||||||||||||
| Sep 25 | Jun 26 | Sep 26 | QoQ | YoY | |||||||||||||
| ASSETS | |||||||||||||||||
| Cash and due from banks | |||||||||||||||||
Non-interest bearing | 7,237,295 | 8,017,699 | 6,606,469 | -17.6% | -8.7% | ||||||||||||
Interest bearing | 35,862,184 | 40,553,153 | 33,981,593 | -16.2% | -5.2% | ||||||||||||
| Total cash and due from banks | 43,099,479 | 48,570,852 | 40,588,062 | -16.4% | -5.8% | ||||||||||||
| Cash collateral, reverse repurchase agreements and securities borrowing | 3,404,639 | 1,185,971 | 1,888,940 | 59.3% | -44.5% | ||||||||||||
| Fair value through profit or loss investments | 4,356,311 | 6,082,417 | 8,977,108 | 47.6% | 106.1% | ||||||||||||
| Fair value through other comprehensive income investments | 38,005,522 | 43,383,090 | 40,750,608 | -6.1% | 7.2% | ||||||||||||
| Amortized cost investments | 8,824,746 | 8,964,556 | 8,876,565 | -1.0% | 0.6% | ||||||||||||
| Loans | 144,752,254 | 159,434,397 | 166,161,042 | 4.2% | 14.8% | ||||||||||||
Current | 139,798,951 | 154,930,212 | 161,617,421 | 4.3% | 15.6% | ||||||||||||
Internal overdue loans | 4,953,303 | 4,504,185 | 4,543,621 | 0.9% | -8.3% | ||||||||||||
Less - allowance for loan losses | (7,674,040) | (7,575,313) | (7,837,815) | 3.5% | 2.1% | ||||||||||||
| Loans, net | 137,078,214 | 151,859,084 | 158,323,227 | 4.3% | 15.5% | ||||||||||||
| Financial assets designated at fair value through profit or loss | 956,885 | 1,163,577 | 1,221,477 | 5.0% | 27.7% | ||||||||||||
| Property, plant and equipment, net | 2,725,302 | 2,598,345 | 2,553,796 | -1.7% | -6.3% | ||||||||||||
| Due from customers on acceptances | 553,561 | 581,699 | 731,400 | 25.7% | 32.1% | ||||||||||||
| Investments in associates | 52,388 | 59,979 | 61,535 | 2.6% | 17.5% | ||||||||||||
| Intangible assets and goodwill, net | 4,596,373 | 4,842,377 | 4,946,348 | 2.1% | 7.6% | ||||||||||||
| Reinsurance contract assets | 853,974 | 830,164 | 772,446 | -7.0% | -9.5% | ||||||||||||
Other assets (1) | 10,673,230 | 12,705,999 | 16,934,288 | 33.3% | 58.7% | ||||||||||||
| Total Assets | 255,180,624 | 282,828,110 | 286,625,800 | 1.3% | 12.3% | ||||||||||||
| LIABILITIES AND EQUITY | |||||||||||||||||
| Deposits and obligations | |||||||||||||||||
Non-interest bearing | 46,588,002 | 58,196,203 | 54,074,734 | -7.1% | 16.1% | ||||||||||||
Interest bearing | 111,842,453 | 123,924,563 | 126,944,123 | 2.4% | 13.5% | ||||||||||||
Total deposits and obligations | 158,430,455 | 182,120,766 | 181,018,857 | -0.6% | 14.3% | ||||||||||||
| Payables from repurchase agreements and securities lending | 10,181,173 | 8,376,486 | 8,081,687 | -3.5% | -20.6% | ||||||||||||
BCRP instruments | 6,643,892 | 4,043,986 | 3,204,454 | -20.8% | -51.8% | ||||||||||||
Repurchase agreements with third parties | 3,401,635 | 4,126,548 | 4,710,856 | 14.2% | 38.5% | ||||||||||||
Repurchase agreements with customers | 135,646 | 205,952 | 166,377 | -19.2% | 22.7% | ||||||||||||
| Due to banks and correspondents | 11,241,079 | 11,755,256 | 11,260,498 | -4.2% | 0.2% | ||||||||||||
| Bonds and notes issued | 12,209,724 | 14,789,015 | 13,273,001 | -10.3% | 8.7% | ||||||||||||
| Banker’s acceptances outstanding | 553,561 | 581,699 | 731,400 | 25.7% | 32.1% | ||||||||||||
| Insurance contract liability | 14,203,439 | 14,996,102 | 14,722,126 | -1.8% | 3.7% | ||||||||||||
| Financial liabilities at fair value through profit or loss | 928,814 | 937,843 | 1,424,395 | 51.9% | 53.4% | ||||||||||||
| Other liabilities | 10,176,606 | 10,469,093 | 15,766,181 | 50.6% | 54.9% | ||||||||||||
| Total Liabilities | 217,924,851 | 244,026,260 | 246,278,145 | 0.9% | 13.0% | ||||||||||||
| Net equity | 36,560,502 | 38,121,924 | 39,629,260 | 4.0% | 8.4% | ||||||||||||
| Capital stock | 1,318,993 | 1,318,993 | 1,318,993 | 0.0% | 0.0% | ||||||||||||
| Treasury stock | (209,845) | (209,106) | (209,106) | 0.0% | -0.4% | ||||||||||||
| Capital surplus | 139,528 | 86,146 | 84,273 | -2.2% | -39.6% | ||||||||||||
| Reserves | 29,628,427 | 32,540,118 | 32,577,140 | 0.1% | 10.0% | ||||||||||||
| Other reserves | 353,144 | 301,385 | (155,575) | -151.6% | -144.1% | ||||||||||||
| Retained earnings | 5,330,255 | 4,084,388 | 6,013,535 | 47.2% | 12.8% | ||||||||||||
| Non-controlling interest | 695,271 | 679,926 | 718,395 | 5.7% | 3.3% | ||||||||||||
| Total Net Equity | 37,255,773 | 38,801,850 | 40,347,655 | 4.0% | 8.3% | ||||||||||||
| Total liabilities and equity | 255,180,624 | 282,828,110 | 286,625,800 | 1.3% | 12.3% | ||||||||||||
| Off-balance sheet | 153,289,772 | 162,878,675 | 156,142,484 | -4.1% | 1.9% | ||||||||||||
| Total performance bonds, stand-by and L/Cs. | 21,007,568 | 20,624,218 | 20,868,786 | 1.2% | -0.7% | ||||||||||||
| Undrawn credit lines, advised but not committed | 78,586,547 | 90,507,627 | 81,516,666 | -9.9% | 3.7% | ||||||||||||
| Total derivatives (notional) and others | 53,695,657 | 51,746,830 | 53,757,032 | 3.9% | 0.1% | ||||||||||||
(1)Includes mainly accounts receivables from brokerage and others
*Due to reclassifications, the Balance Sheet may differ from those reported in previous quarters.
56
| | | Earnings Release 3Q / 2026 | Analysis of 3Q26 Consolidated Results | ||||||||
12. Appendix | |||||||||||
Consolidated Statement of Income
(S/ Thousands, IFRS)
| Quarter | % Change | Up to | % Change | |||||||||||||||||||||||
| 3Q25 | 2Q26 | 3Q26 | QoQ | YoY | Sep 25 | Sep 26 | Sep 26 / Sep 25 | |||||||||||||||||||
| Interest income and expense | ||||||||||||||||||||||||||
| Interest and similar income | 4,987,693 | 5,413,885 | 5,717,687 | 5.6% | 14.6% | 14,804,775 | 16,343,984 | 10.4% | ||||||||||||||||||
| Interest and similar expenses | (1,299,864) | (1,316,934) | (1,376,563) | 4.5% | 5.9% | (3,929,563) | (3,943,182) | 0.3% | ||||||||||||||||||
| Net interest, similar income and expenses | 3,687,829 | 4,096,951 | 4,341,124 | 6.0% | 17.7% | 10,875,212 | 12,400,802 | 14.0% | ||||||||||||||||||
| Provision for credit losses on loan portfolio | (720,445) | (854,827) | (982,850) | 15.0% | 36.4% | (2,100,143) | (2,449,688) | 16.6% | ||||||||||||||||||
| Recoveries of written-off loans | 117,527 | 123,619 | 154,714 | 25.2% | 31.6% | 340,173 | 408,256 | 20.0% | ||||||||||||||||||
| Provision for credit losses on loan portfolio, net of recoveries | (602,918) | (731,208) | (828,136) | 13.3% | 37.4% | (1,759,970) | (2,041,432) | 16.0% | ||||||||||||||||||
| Net interest, similar income and expenses, after provision for credit losses on loan portfolio | 3,084,911 | 3,365,743 | 3,512,988 | 4.4% | 13.9% | 9,115,242 | 10,359,370 | 13.6% | ||||||||||||||||||
| Other income | ||||||||||||||||||||||||||
| Fee income | 1,063,032 | 1,187,608 | 1,280,004 | 7.8% | 20.4% | 3,081,609 | 3,616,896 | 17.4% | ||||||||||||||||||
| Net gain on foreign exchange transactions | 394,572 | 489,479 | 451,089 | -7.8% | 14.3% | 1,115,402 | 1,389,452 | 24.6% | ||||||||||||||||||
| Net gain (loss) on securities | 111,977 | 248,844 | 57,377 | -76.9% | -48.8% | 263,002 | 441,858 | 68.0% | ||||||||||||||||||
| Net gain from associates | 5,192 | 6,156 | 6,125 | -0.5% | 18.0% | 35,816 | 21,577 | -39.8% | ||||||||||||||||||
| Net gain (loss) on derivatives held for trading | 244 | (14,697) | 51,031 | -447.2% | 20,814.3% | 40,161 | 63,797 | 58.9% | ||||||||||||||||||
| Net gain (loss) from exchange differences | 7,518 | 44,160 | 16,263 | -63.2% | 116.3% | 33,672 | 68,980 | 104.9% | ||||||||||||||||||
| Others | 71,656 | 80,652 | 29,790 | -63.1% | -58.4% | 452,118 | 187,645 | -58.5% | ||||||||||||||||||
| Total other income | 1,654,191 | 2,042,202 | 1,891,679 | -7.4% | 14.4% | 5,021,780 | 5,790,205 | 15.3% | ||||||||||||||||||
| Insurance underwriting result | ||||||||||||||||||||||||||
| Insurance Service Result | 467,467 | 429,944 | 425,968 | -0.9% | -8.9% | 1,328,725 | 1,201,758 | -9.6% | ||||||||||||||||||
| Reinsurance Result | (79,117) | (141,930) | (63,645) | -55.2% | -19.6% | -260,368 | -252,358 | -3.1% | ||||||||||||||||||
| Total insurance underwriting result | 388,350 | 288,014 | 362,323 | 25.8% | -6.7% | 1,068,357 | 949,400 | -11.1% | ||||||||||||||||||
| Medical services result | ||||||||||||||||||||||||||
| Sales of medical services | 421,360 | 440,364 | 449,707 | 2.1% | 6.7% | 973,227 | 1,314,636 | 35.1% | ||||||||||||||||||
| Cost of sales of medical services | (297,407) | (306,925) | (313,320) | 2.1% | 5.4% | (683,266) | (920,972) | 34.8% | ||||||||||||||||||
| Total medical services result | 123,953 | 133,439 | 136,387 | 2.2% | 10.0% | 289,961 | 393,664 | 35.8% | ||||||||||||||||||
| Total Expenses | ||||||||||||||||||||||||||
| Salaries and employee benefits | (1,341,137) | (1,475,704) | (1,548,820) | 5.0% | 15.5% | (4,007,293) | (4,483,945) | 11.9% | ||||||||||||||||||
| Administrative, general and tax expenses | (1,068,459) | (1,114,932) | (1,207,786) | 8.3% | 13.0% | (2,904,287) | (3,384,384) | 16.5% | ||||||||||||||||||
| Depreciation and amortization | (219,800) | (235,204) | (240,861) | 2.4% | 9.6% | (636,228) | (717,433) | 12.8% | ||||||||||||||||||
| Impairment loss on goodwill | — | — | — | — | — | |||||||||||||||||||||
| Association in participation | (65) | (155) | (124) | -20.0% | 90.8% | (7,235) | (452) | -93.8% | ||||||||||||||||||
| Other expenses | (115,181) | (163,467) | (110,989) | -32.1% | -3.6% | (352,783) | (352,659) | —% | ||||||||||||||||||
| Total expenses | (2,744,642) | (2,989,462) | (3,108,580) | 4.0% | 13.3% | -7,907,826 | -8,938,873 | 13.0% | ||||||||||||||||||
| Profit before income tax | 2,506,763 | 2,839,936 | 2,794,797 | -1.6% | 11.5% | 7,587,514 | 8,553,766 | 12.7% | ||||||||||||||||||
| Income tax | (728,308) | (814,357) | (820,898) | 0.8% | 12.7% | (2,129,746) | (2,444,146) | 14.8% | ||||||||||||||||||
| Net profit | 1,778,455 | 2,025,579 | 1,973,899 | -2.6% | 11.0% | 5,457,768 | 6,109,620 | 11.9% | ||||||||||||||||||
| Non-controlling interest | 39,800 | 43,657 | 44,488 | 1.9% | 11.8% | 119,401 | 135,103 | 13.2% | ||||||||||||||||||
| Net profit attributable to Credicorp | 1,738,655 | 1,981,922 | 1,929,411 | -2.6% | 11.0% | 5,338,367 | 5,974,517 | 11.9% | ||||||||||||||||||
57
| | | Earnings Release 3Q / 2026 | Analysis of 3Q26 Consolidated Results | ||||||||
12. Appendix | |||||||||||
12.7.2. Credicorp Stand-alone
Statement of Financial Position
(S/ Thousands, IFRS)
| As of | % Change | ||||||||||||||||
| Sep 25 | Jun 26 | Sep 26 | QoQ | YoY | |||||||||||||
| ASSETS | |||||||||||||||||
| Cash and cash equivalents | 121,123 | 103,664 | 89,345 | -13.8% | -26.2% | ||||||||||||
| At fair value through profit or loss | - | - | - | n.a. | n.a. | ||||||||||||
| Fair value through other comprehensive income investments | 101,222 | 102,521 | 152,065 | 48.3% | 50.2% | ||||||||||||
| In subsidiaries and associates investments | 40,527,583 | 42,353,237 | 43,883,430 | 3.6% | 8.3% | ||||||||||||
| Investments at amortized cost | - | - | - | n.a. | n.a. | ||||||||||||
| Other assets | 9,626 | 10,304 | 7,057 | -31.5% | -26.7% | ||||||||||||
| Total Assets | 40,759,554 | 42,569,726 | 44,131,897 | 3.7% | 8.3% | ||||||||||||
| LIABILITIES AND NET SHAREHOLDERS’ EQUITY | |||||||||||||||||
| Due to banks, correspondents and other entities | - | - | - | n.a. | n.a. | ||||||||||||
| Bonds and notes issued | - | - | - | n.a. | n.a. | ||||||||||||
| Other liabilities | 211,103 | 206,504 | 274,219 | 32.8% | 29.9% | ||||||||||||
| Total Liabilities | 211,103 | 206,504 | 274,219 | 32.8% | 29.9% | ||||||||||||
| NET EQUITY | |||||||||||||||||
| Capital stock | 1,318,993 | 1,318,993 | 1,318,993 | 0.0% | 0.0% | ||||||||||||
| Capital Surplus | 384,542 | 384,542 | 384,542 | 0.0% | 0.0% | ||||||||||||
| Reserve | 28,438,904 | 30,611,123 | 30,611,050 | 0.0% | 7.6% | ||||||||||||
| Unrealized results | 51,015 | 101,416 | (356,032) | n.a. | n.a. | ||||||||||||
| Retained earnings | 10,354,997 | 9,947,148 | 11,899,125 | 19.6% | 14.9% | ||||||||||||
| Total net equity | 40,548,451 | 42,363,222 | 43,857,678 | 3.5% | 8.2% | ||||||||||||
| Total Liabilities And Equity | 40,759,554 | 42,569,726 | 44,131,897 | 3.7% | 8.3% | ||||||||||||
Statement of Income
(S/ Thousands, IFRS)
| Quarter | % Change | Up to | % Change | |||||||||||||||||||||||
| 3Q25 | 2Q26 | 3Q26 | QoQ | YoY | Sep 25 | Sep 26 | Sep 26 / Sep 25 | |||||||||||||||||||
| Interest income | ||||||||||||||||||||||||||
| Net share of the income from investments in subsidiaries and associates | 1,820,416 | 2,848,937 | 2,016,961 | -29.2% | 10.8% | 5,971,110 | 7,024,829 | 17.6% | ||||||||||||||||||
| Interest and similar income | 300 | 4,403 | 292 | -93.4% | -2.7% | 40,893 | 5,482 | -86.6% | ||||||||||||||||||
| Net gain on financial assets at fair value through profit or loss | - | - | - | n.a. | n.a. | - | - | n.a. | ||||||||||||||||||
| Total income | 1,820,716 | 2,853,340 | 2,017,253 | -29.3% | 10.8% | 6,012,003 | 7,030,311 | 16.9% | ||||||||||||||||||
| Interest and similar expense | (8) | - | 5 | n.a. | -162.5% | (24,525) | 5 | n.a. | ||||||||||||||||||
| Administrative and general expenses | (4,535) | (7,404) | (4,825) | -34.8% | 6.4% | (14,704) | (16,071) | 9.3% | ||||||||||||||||||
| Total expenses | (4,543) | (7,404) | (4,820) | -34.9% | 6.1% | (39,229) | (16,066) | -59.0% | ||||||||||||||||||
| Operating income | 1,816,173 | 2,845,936 | 2,012,433 | -29.3% | 10.8% | 5,972,774 | 7,014,245 | 17.4% | ||||||||||||||||||
| Results from exchange differences | 67 | (3,868) | 28 | -100.7% | -58.2% | (3,336) | (3,472) | 4.1% | ||||||||||||||||||
| Other, net | 93 | (9) | (12) | 33.3% | -112.9% | (323) | (479) | 48.3% | ||||||||||||||||||
| Profit before income tax | 1,816,333 | 2,842,059 | 2,012,449 | -29.2% | 10.8% | 5,969,115 | 7,010,294 | 17.4% | ||||||||||||||||||
| Income tax | (60,945) | (74,722) | (67,939) | -9.1% | 11.5% | (158,326) | (209,026) | 32.0% | ||||||||||||||||||
| Net income | 1,755,388 | 2,767,337 | 1,944,510 | -29.7% | 10.8% | 5,810,789 | 6,801,268 | 17.0% | ||||||||||||||||||
| Double Leverage Ratio | 99.9% | 100.0% | 100.1% | 8 bps | 11 bps | 99.9% | 100.1% | 11 bps | ||||||||||||||||||
58
| | | Earnings Release 3Q / 2026 | Analysis of 3Q26 Consolidated Results | ||||||||
12. Appendix | |||||||||||
12.7.3. BCP Consolidated
Consolidated Statement of Financial Position
(S/ Thousands, IFRS)
| As of | % Change | ||||||||||||||||
| Sep 25 | Jun 26 | Sep 26 | QoQ | YoY | |||||||||||||
| ASSETS | |||||||||||||||||
| Cash and due from banks | |||||||||||||||||
| Non-interest bearing | 5,571,298 | 6,333,246 | 5,166,468 | -18.4% | -7.3% | ||||||||||||
| Interest bearing | 33,968,802 | 38,532,091 | 32,035,195 | -16.9% | -5.7% | ||||||||||||
| Total cash and due from banks | 39,540,100 | 44,865,337 | 37,201,663 | -17.1% | -5.9% | ||||||||||||
| Cash collateral, reverse repurchase agreements and securities borrowing | 1,211,354 | 688,747 | 1,162,417 | 68.8% | -4.0% | ||||||||||||
| Fair value through profit or loss investments | 368,478 | 671,728 | 3,714,136 | n.a. | n.a. | ||||||||||||
| Fair value through other comprehensive income investments | 21,868,305 | 25,698,691 | 23,538,299 | -8.4% | 7.6% | ||||||||||||
| Amortized cost investments | 8,124,785 | 8,415,578 | 8,370,300 | -0.5% | 3.0% | ||||||||||||
| Loans | 135,408,707 | 148,016,682 | 155,469,747 | 5.0% | 14.8% | ||||||||||||
| Current | 130,730,717 | 143,838,433 | 151,234,794 | 5.1% | 15.7% | ||||||||||||
| Internal overdue loans | 4,677,990 | 4,178,249 | 4,234,953 | 1.4% | -9.5% | ||||||||||||
| Less - allowance for loan losses | (7,284,860) | (7,099,026) | (7,404,291) | 4.3% | 1.6% | ||||||||||||
| Loans, net | 128,123,847 | 140,917,656 | 148,065,456 | 5.1% | 15.6% | ||||||||||||
Property, furniture and equipment, net (1) | 1,558,842 | 1,523,338 | 1,492,983 | -2.0% | -4.2% | ||||||||||||
| Due from customers on acceptances | 553,851 | 581,699 | 731,400 | 25.7% | 32.1% | ||||||||||||
| Investments in associates | 25,660 | 34,128 | 34,815 | 2.0% | 35.7% | ||||||||||||
Other assets (2) | 8,135,126 | 10,389,466 | 14,112,997 | 35.8% | 73.5% | ||||||||||||
| Total Assets | 209,510,348 | 233,786,368 | 238,424,466 | 2.0% | 13.8% | ||||||||||||
| Liabilities and Equity | |||||||||||||||||
| Deposits and obligations | |||||||||||||||||
| Non-interest bearing | 42,835,241 | 55,615,167 | 51,775,372 | -6.9% | 20.9% | ||||||||||||
| Interest bearing | 104,254,936 | 114,559,259 | 118,703,504 | 3.6% | 13.9% | ||||||||||||
| Total deposits and obligations | 147,090,177 | 170,174,426 | 170,478,876 | 0.2% | 15.9% | ||||||||||||
| Payables from repurchase agreements and securities lending | 7,347,033 | 5,734,750 | 5,806,511 | 1.3% | -21.0% | ||||||||||||
| BCRP instruments | 6,642,780 | 4,037,936 | 3,203,880 | -20.7% | -51.8% | ||||||||||||
| Repurchase agreements with third parties | 704,253 | 1,696,814 | 2,602,631 | 53.4% | 269.6% | ||||||||||||
| Due to banks and correspondents | 10,529,292 | 10,864,183 | 10,411,422 | -4.2% | -1.1% | ||||||||||||
| Bonds and notes issued | 10,114,714 | 12,082,162 | 10,456,203 | -13.5% | 3.4% | ||||||||||||
| Banker’s acceptances outstanding | 553,851 | 581,699 | 731,400 | 25.7% | 32.1% | ||||||||||||
| Financial liabilities at fair value through profit or loss | 455,454 | 604,407 | 875,178 | 44.8% | 92.2% | ||||||||||||
Other liabilities (3) | 6,665,448 | 7,177,416 | 11,770,667 | 64.0% | 76.6% | ||||||||||||
| Total Liabilities | 182,755,969 | 207,219,043 | 210,530,257 | 1.6% | 15.2% | ||||||||||||
| Net equity | 26,610,823 | 26,417,998 | 27,742,279 | 5.0% | 4.3% | ||||||||||||
Capital stock | 12,679,794 | 12,679,794 | 12,679,794 | 0.0% | 0.0% | ||||||||||||
| Reserves | 5,906,590 | 5,907,974 | 5,907,974 | 0.0% | 0.0% | ||||||||||||
Unrealized gains and losses | 507,687 | 435,541 | (47,596) | -110.9% | -109.4% | ||||||||||||
Retained earnings | 7,516,752 | 7,394,689 | 9,202,107 | 24.4% | 22.4% | ||||||||||||
| Non-controlling interest | 143,556 | 149,327 | 151,930 | 1.7% | 5.8% | ||||||||||||
| Total Net Equity | 26,754,379 | 26,567,325 | 27,894,209 | 5.0% | 4.3% | ||||||||||||
| Total liabilities and equity | 209,510,348 | 233,786,368 | 238,424,466 | 2.0% | 13.8% | ||||||||||||
| Off-balance sheet | 146,718,825 | 150,106,967 | 147,290,400 | -1.9% | 0.4% | ||||||||||||
| Total performance bonds, stand-by and L/Cs. | 20,740,429 | 20,280,743 | 20,665,329 | 1.9% | -0.4% | ||||||||||||
| Undrawn credit lines, advised but not committed | 72,873,063 | 78,605,209 | 73,569,033 | -6.4% | 1.0% | ||||||||||||
| Total derivatives (notional) and others | 53,105,333 | 51,221,015 | 53,056,038 | 3.6% | -0.1% | ||||||||||||
(1)Right of use asset of lease contracts is included by application of IFRS 16.
(2)Mainly includes intangible assets, other receivable accounts, trading derivatives receivable accounts and tax credit.
(3)Mainly includes other payable accounts, trading derivatives payable accounts and taxes for payable.
59
| | | Earnings Release 3Q / 2026 | Analysis of 3Q26 Consolidated Results | ||||||||
12. Appendix | |||||||||||
Banco de Credito del Peru
Consolidated Statement of Income
(S/ Thousands, IFRS)
| Quarter | % Change | Up to | % Change | |||||||||||||||||||||||
| 3Q25 | 2Q26 | 3Q26 | QoQ | YoY | Sep 25 | Sep 26 | Sep 26 / Sep 25 | |||||||||||||||||||
| Interest income and expense | ||||||||||||||||||||||||||
| Interest and similar income | 4,359,098 | 4,704,069 | 4,944,878 | 5.1% | 13.4% | 12,929,405 | 14,143,589 | 9.4% | ||||||||||||||||||
Interest and similar expense (1) | (930,847) | (902,791) | (934,336) | 3.5% | 0.4% | (2,859,195) | (2,703,030) | -5.5% | ||||||||||||||||||
| Interest income and expense | 3,428,251 | 3,801,278 | 4,010,542 | 5.5% | 17.0% | 10,070,210 | 11,440,559 | 13.6% | ||||||||||||||||||
| Provision for credit losses on loan portfolio | (675,251) | (776,343) | (914,118) | 17.7% | 35.4% | (1,958,121) | (2,229,208) | 13.8% | ||||||||||||||||||
| Recoveries of written-off loans | 113,472 | 115,665 | 147,649 | 27.7% | 30.1% | 327,474 | 389,082 | 18.8% | ||||||||||||||||||
| Provision for credit losses on loan portfolio, net of recoveries | (561,779) | (660,678) | (766,469) | 16.0% | 36.4% | (1,630,647) | (1,840,126) | 12.8% | ||||||||||||||||||
| Net interest, similar income and expenses, after provision for credit losses on loan portfolio | 2,866,472 | 3,140,600 | 3,244,073 | 3.3% | 13.2% | 8,439,563 | 9,600,433 | 13.8% | ||||||||||||||||||
| Other income | ||||||||||||||||||||||||||
| Fee income | 902,082 | 1,009,878 | 1,107,370 | 9.7% | 22.8% | 2,644,037 | 3,113,953 | 17.8% | ||||||||||||||||||
| Net gain on foreign exchange transactions | 349,768 | 419,458 | 406,958 | -3.0% | 16.4% | 1,004,844 | 1,215,788 | 21.0% | ||||||||||||||||||
| Net gain (loss) on securities | 2,683 | 11,349 | 7,932 | -30.1% | 195.6% | 135,170 | 89,542 | -33.8% | ||||||||||||||||||
| Net gain on derivatives held for trading | 33,178 | 62,255 | 13,641 | -78.1% | -58.9% | 78,020 | 97,176 | 24.6% | ||||||||||||||||||
| Net loss (gain) from exchange differences | (1,064) | 13,692 | 3,210 | -76.6% | -401.7% | 7,261 | 29,287 | 303.3% | ||||||||||||||||||
| Others | 28,774 | 28,408 | 14,861 | -47.7% | -48.4% | 83,173 | 62,707 | -24.6% | ||||||||||||||||||
| Total other income | 1,315,421 | 1,545,040 | 1,553,972 | 0.6% | 18.1% | 3,952,505 | 4,608,453 | 16.6% | ||||||||||||||||||
| Total expenses | ||||||||||||||||||||||||||
| Salaries and employee benefits | (958,832) | (1,070,222) | (1,110,298) | 3.7% | 15.8% | (2,890,077) | (3,231,501) | 11.8% | ||||||||||||||||||
| Administrative expenses | (805,053) | (849,887) | (918,913) | 8.1% | 14.1% | (2,166,648) | (2,552,020) | 17.8% | ||||||||||||||||||
Depreciation and amortization (2) | (181,978) | (188,401) | (196,002) | 4.0% | 7.7% | (526,134) | (575,977) | 9.5% | ||||||||||||||||||
| Other expenses | (55,223) | (103,916) | (84,352) | -18.8% | 52.7% | (165,841) | (249,470) | 50.4% | ||||||||||||||||||
| Total expenses | (2,001,086) | (2,212,426) | (2,309,565) | 4.4% | 15.4% | (5,748,700) | (6,608,968) | 15.0% | ||||||||||||||||||
| Profit before income tax | 2,180,807 | 2,473,214 | 2,488,480 | 0.6% | 14.1% | 6,643,368 | 7,599,918 | 14.4% | ||||||||||||||||||
| Income tax | (577,612) | (654,887) | (657,401) | 0.4% | 13.8% | (1,703,419) | (1,988,377) | 16.7% | ||||||||||||||||||
| Net profit | 1,603,195 | 1,818,327 | 1,831,079 | 0.7% | 14.2% | 4,939,949 | 5,611,541 | 13.6% | ||||||||||||||||||
| Non-controlling interest | (6,114) | (7,782) | (7,051) | -9.4% | 15.3% | (15,970) | (22,286) | 39.5% | ||||||||||||||||||
| Net profit attributable to BCP Consolidated | 1,597,081 | 1,810,545 | 1,824,028 | 0.7% | 14.2% | 4,923,979 | 5,589,255 | 13.5% | ||||||||||||||||||
(1)Financing expenses related to lease agreements are included according to the application of IFRS 16.
(2)The effect of the application of IFRS 16 is included, which corresponds to a greater depreciation for the asset for right-of-use”.
Selected Financial Indicators
Quarter | Change | Up to | Change | |||||||||||||||||||||||
| 3Q25 | 2Q26 | 3Q26 | QoQ | YoY | Sep 25 | Sep 26 | Sep 26 / Sep 25 | |||||||||||||||||||
| Profitability | ||||||||||||||||||||||||||
ROAA (1)(2) | 3.1% | 3.1% | 3.1% | -4 bps | 0 bps | 3.1% | 3.2% | 12 bps | ||||||||||||||||||
ROAE (1)(2) | 24.9% | 28.5% | 26.9% | -158 bps | 209 bps | 25.0% | 26.6% | 164 bps | ||||||||||||||||||
Net interest margin (1)(2) | 6.89% | 6.90% | 7.19% | 28 bps | 30 bps | 6.46% | 7.02% | 55 bps | ||||||||||||||||||
Risk-adjusted Net interest margin (1)(2) | 5.76% | 5.70% | 5.81% | 11 bps | 5 bps | 5.42% | 5.89% | 47 bps | ||||||||||||||||||
Funding cost (1)(2)(3) | 2.14% | 1.86% | 1.88% | 3 bps | -25 bps | 2.16% | 1.88% | -27 bps | ||||||||||||||||||
Loan portfolio quality | ||||||||||||||||||||||||||
Internal overdue ratio | 3.5% | 2.8% | 2.7% | -10 bps | -73 bps | 3.5% | 2.7% | -73 bps | ||||||||||||||||||
NPL ratio | 4.9% | 4.0% | 3.8% | -20 bps | -102 bps | 4.9% | 3.8% | -102 bps | ||||||||||||||||||
Coverage ratio of IOLs | 155.7% | 169.9% | 174.8% | 493 bps | 1911 bps | 155.7% | 174.8% | 1911 bps | ||||||||||||||||||
Coverage ratio of NPLs | 110.9% | 118.9% | 124.2% | 530 bps | 1332 bps | 110.9% | 124.2% | 1332 bps | ||||||||||||||||||
Cost of risk (4) | 1.7% | 1.8% | 2.0% | 19 bps | 35 bps | 1.6% | 1.7% | 4 bps | ||||||||||||||||||
Operating efficiency | ||||||||||||||||||||||||||
Operating expenses / Total income (5) | 41.3% | 39.7% | 40.2% | 42 bps | -114 bps | 40.4% | 40.0% | -44 bps | ||||||||||||||||||
Operating expenses / Total average assets (1)(2)(5) | 3.8% | 3.6% | 3.8% | 12 bps | 1 bps | 3.5% | 3.7% | 15 bps | ||||||||||||||||||
(1)Ratios are annualized.
(2)Averages are determined as the average of period-beginning and period-ending balances.
(3)The funding costs differs from previously reported due to a methodology change in the denominator, which no longer includes the following accounts: acceptances outstanding, reserves for property and casualty claims, reserve for unearned premiums, reinsurance payable and other liabilities.
(4)Cost of risk: Annualized provision for loan losses / Average Total loans.
(5)Total income includes net interest income, fee income, net gain on foreign exchange transactions, result on exchange difference and net gain on derivatives. Operating expenses includes Salaries and social benefits, administrative, general and tax expenses and depreciation and amortization.
60
| | | Earnings Release 3Q / 2026 | Analysis of 3Q26 Consolidated Results | ||||||||
12. Appendix | |||||||||||
12.7.4. BCP Stand-alone
Banco de Credito del Peru
Statement of Financial Position
(S/ Thousands, IFRS)
| As of | % Change | ||||||||||||||||
| Sep 25 | Jun 26 | Sep 26 | QoQ | YoY | |||||||||||||
| ASSETS | |||||||||||||||||
| Cash and due from banks | |||||||||||||||||
| Non-interest bearing | 4,968,923 | 5,723,761 | 4,487,412 | -21.6% | -9.7% | ||||||||||||
| Interest bearing | 32,541,803 | 37,486,290 | 30,947,256 | -17.4% | -4.9% | ||||||||||||
| Total cash and due from banks | 37,510,726 | 43,210,051 | 35,434,668 | -18.0% | -5.5% | ||||||||||||
| Cash collateral, reverse repurchase agreements and securities borrowing | 1,211,354 | 688,747 | 1,162,417 | 68.8% | -4.0% | ||||||||||||
| Fair value through profit or loss investments | 368,478 | 671,728 | 3,714,136 | n.a. | n.a. | ||||||||||||
| Fair value through other comprehensive income investments | 19,479,618 | 23,015,307 | 20,723,988 | -10.0% | 6.4% | ||||||||||||
| Amortized cost investments | 8,025,196 | 8,293,837 | 8,162,450 | -1.6% | 1.7% | ||||||||||||
| Loans | 123,089,317 | 134,206,650 | 141,044,423 | 5.1% | 14.6% | ||||||||||||
| Current | 119,030,125 | 130,594,244 | 137,396,214 | 5.2% | 15.4% | ||||||||||||
| Internal overdue loans | 4,059,192 | 3,612,406 | 3,648,209 | 1.0% | -10.1% | ||||||||||||
| Less - allowance for loan losses | (6,378,494) | (6,084,399) | (6,284,951) | 3.3% | -1.5% | ||||||||||||
| Loans, net | 116,710,823 | 128,122,251 | 134,759,472 | 5.2% | 15.5% | ||||||||||||
Property, furniture and equipment, net (1) | 1,358,608 | 1,345,462 | 1,317,004 | -2.1% | -3.1% | ||||||||||||
| Due from customers on acceptances | 553,851 | 581,699 | 731,400 | 25.7% | 32.1% | ||||||||||||
| Investments in associates | 2,601,973 | 2,721,368 | 2,767,236 | 1.7% | 6.4% | ||||||||||||
Other assets (2) | 7,555,427 | 9,684,450 | 13,404,783 | 38.4% | 77.4% | ||||||||||||
| Total Assets | 195,376,054 | 218,334,900 | 222,177,554 | 1.8% | 13.7% | ||||||||||||
| Liabilities and Equity | |||||||||||||||||
| Deposits and obligations | |||||||||||||||||
| Non-interest bearing | 42,813,340 | 55,589,242 | 51,746,689 | -6.9% | 20.9% | ||||||||||||
| Interest bearing | 93,468,558 | 103,225,868 | 106,927,659 | 3.6% | 14.4% | ||||||||||||
| Total deposits and obligations | 136,281,898 | 158,815,110 | 158,674,348 | -0.1% | 16.4% | ||||||||||||
| Payables from repurchase agreements and securities lending | 6,850,850 | 4,967,176 | 4,916,063 | -1.0% | -28.2% | ||||||||||||
| BCRP instruments | 6,146,597 | 3,270,362 | 2,313,432 | -29.3% | -62.4% | ||||||||||||
| Repurchase agreements with third parties | 704,253 | 1,696,814 | 2,602,631 | 53.4% | 269.6% | ||||||||||||
| Due to banks and correspondents | 8,904,033 | 9,160,586 | 8,736,009 | -4.6% | -1.9% | ||||||||||||
| Bonds and notes issued | 9,508,030 | 11,171,934 | 9,371,160 | -16.1% | -1.4% | ||||||||||||
| Due from customers on acceptances | 553,851 | 581,699 | 731,400 | 25.7% | 32.1% | ||||||||||||
| Financial liabilities at fair value through profit or loss | 455,454 | 604,407 | 875,178 | 44.8% | 92.2% | ||||||||||||
Other liabilities (3) | 6,206,153 | 6,611,101 | 11,126,804 | 68.3% | 79.3% | ||||||||||||
| Total Liabilities | 168,760,269 | 191,912,013 | 194,430,962 | 1.3% | 15.2% | ||||||||||||
| Net equity | 26,615,785 | 26,422,887 | 27,746,592 | 5.0% | 4.2% | ||||||||||||
| Capital stock | 12,679,794 | 12,679,794 | 12,679,794 | 0.0% | 0.0% | ||||||||||||
| Reserves | 5,906,590 | 5,907,974 | 5,907,974 | 0.0% | 0.0% | ||||||||||||
| Unrealized gains and losses | 505,339 | 435,898 | (47,698) | -110.9% | -109.4% | ||||||||||||
| Retained earnings | 7,524,062 | 7,399,221 | 9,206,522 | 24.4% | 22.4% | ||||||||||||
| Total Net Equity | 26,615,785 | 26,422,887 | 27,746,592 | 5.0% | 4.2% | ||||||||||||
| Total liabilities and equity | 195,376,054 | 218,334,900 | 222,177,554 | 1.8% | 13.7% | ||||||||||||
| Off-balance sheet | 143,063,117 | 145,192,871 | 141,463,919 | -2.6% | -1.1% | ||||||||||||
| Total performance bonds, stand-by and L/Cs. | 20,740,429 | 20,280,743 | 20,665,329 | 1.9% | -0.4% | ||||||||||||
| Undrawn credit lines, advised but not committed | 69,365,422 | 73,700,933 | 68,047,931 | -7.7% | -1.9% | ||||||||||||
| Total derivatives (notional) and others | 52,957,266 | 51,211,195 | 52,750,659 | 3.0% | -0.4% | ||||||||||||
(1)Right of use asset of lease contracts is included by application of IFRS 16.
(2)Mainly includes intangible assets, other receivable accounts, trading derivatives receivable accounts and tax credit
(3)Mainly includes other payable accounts, trading derivatives payable accounts and taxes for payable.
61
| | | Earnings Release 3Q / 2026 | Analysis of 3Q26 Consolidated Results | ||||||||
12. Appendix | |||||||||||
Banco de Credito del Peru
Statement of Income
(S/ Thousands, IFRS)
Quarter | % Change | Up to | % Change | |||||||||||||||||||||||
| 3Q25 | 2Q26 | 3Q26 | QoQ | YoY | Sep 25 | Sep 26 | Sep 26 / Sep 25 | |||||||||||||||||||
| Interest income and expense | ||||||||||||||||||||||||||
| Interest and similar income | 3,570,917 | 3,833,800 | 4,037,704 | 5.3% | 13.1% | 10,625,131 | 11,526,672 | 8.5% | ||||||||||||||||||
Interest and similar expenses (1) | (776,188) | (740,772) | (763,286) | 3.0% | -1.7% | (2,374,392) | (2,209,669) | -6.9% | ||||||||||||||||||
| Interest income and expense | 2,794,729 | 3,093,028 | 3,274,418 | 5.9% | 17.2% | 8,250,739 | 9,317,003 | 12.9% | ||||||||||||||||||
| Provision for credit losses on loan portfolio | (484,000) | (568,414) | (672,441) | 18.3% | 38.9% | (1,392,022) | (1,593,432) | 14.5% | ||||||||||||||||||
| Recoveries of written-off loans | 89,802 | 93,012 | 125,682 | 35.1% | 40.0% | 255,899 | 323,105 | 26.3% | ||||||||||||||||||
| Provision for credit losses on loan portfolio, net of recoveries | (394,198) | (475,402) | (546,759) | 15.0% | 38.7% | (1,136,123) | (1,270,327) | 11.8% | ||||||||||||||||||
| Net interest, similar income and expenses, after provision for credit losses on loan portfolio | 2,400,531 | 2,617,626 | 2,727,659 | 4.2% | 13.6% | 7,114,616 | 8,046,676 | 13.1% | ||||||||||||||||||
| Other income | ||||||||||||||||||||||||||
| Fee income | 873,187 | 970,331 | 1,070,483 | 10.3% | 22.6% | 2,558,334 | 3,002,360 | 17.4% | ||||||||||||||||||
| Net gain on foreign exchange transactions | 347,104 | 415,666 | 403,568 | -2.9% | 16.3% | 997,874 | 1,205,489 | 20.8% | ||||||||||||||||||
| Net gain on securities | 117,414 | 155,819 | 138,988 | -10.8% | 18.4% | 433,302 | 496,298 | 14.5% | ||||||||||||||||||
| Net gain (loss) from associates | 1,137 | 2,626 | 2,444 | -6.9% | 115.0% | 3,998 | 8,626 | 115.8% | ||||||||||||||||||
| Net gain on derivatives held for trading | 36,289 | 65,027 | 12,350 | -81.0% | -66.0% | 85,986 | 89,046 | 3.6% | ||||||||||||||||||
| Net loss (gain) from exchange differences | (4,779) | 9,486 | 4,066 | -57.1% | -185.1% | (1,608) | 32,234 | n.a. | ||||||||||||||||||
| Others | 27,933 | 28,740 | 13,644 | -52.5% | -51.2% | 79,081 | 59,918 | -24.2% | ||||||||||||||||||
| Total other income | 1,398,285 | 1,647,695 | 1,645,543 | -0.1% | 17.7% | 4,156,967 | 4,893,971 | 17.7% | ||||||||||||||||||
| Total expenses | ||||||||||||||||||||||||||
| Salaries and employee benefits | (728,954) | (830,345) | (859,010) | 3.5% | 17.8% | (2,196,784) | (2,506,850) | 14.1% | ||||||||||||||||||
| Administrative expenses | (729,297) | (760,449) | (830,933) | 9.3% | 13.9% | (1,947,733) | (2,278,131) | 17.0% | ||||||||||||||||||
Depreciation and amortization (2) | (158,769) | (165,501) | (173,402) | 4.8% | 9.2% | (456,581) | (507,504) | 11.2% | ||||||||||||||||||
| Other expenses | (49,126) | (96,107) | (75,433) | -21.5% | 53.6% | (149,070) | (223,444) | 49.9% | ||||||||||||||||||
| Total expenses | (1,666,146) | (1,852,402) | (1,938,778) | 4.7% | 16.4% | (4,750,168) | (5,515,929) | 16.1% | ||||||||||||||||||
| Profit before income tax | 2,132,670 | 2,412,919 | 2,434,424 | 0.9% | 14.1% | 6,521,415 | 7,424,718 | 13.9% | ||||||||||||||||||
| Income tax | (535,124) | (600,161) | (610,514) | 1.7% | 14.1% | (1,595,713) | (1,837,263) | 15.1% | ||||||||||||||||||
| Net profit | 1,597,546 | 1,812,758 | 1,823,910 | 0.6% | 14.2% | 4,925,702 | 5,587,455 | 13.4% | ||||||||||||||||||
| Non-controlling interest | ||||||||||||||||||||||||||
| Net profit attributable to BCP | 1,597,546 | 1,812,758 | 1,823,910 | 0.6% | 14.2% | 4,925,702 | 5,587,455 | 13.4% | ||||||||||||||||||
(1)Financing expenses related to lease agreements are included according to the application of IFRS 16.
(2)The effect of the application of IFRS 16 is included, which corresponds to a greater depreciation for the asset for right-of-use”.
Selected Financial Indicators
Quarter | % Change | Up to | % Change | |||||||||||||||||||||||
| 3Q25 | 2Q26 | 3Q26 | QoQ | YoY | Sep 25 | Sep 26 | Sep 26/Sep 25 | |||||||||||||||||||
| Profitability | ||||||||||||||||||||||||||
ROAA (1)(2) | 3.3% | 3.4% | 3.3% | -4 bps | 0 bps | 3.3% | 3.5% | 15 bps | ||||||||||||||||||
ROAE (1)(2) | 24.9% | 28.6% | 26.9% | -162 bps | 208 bps | 25.0% | 26.6% | 163 bps | ||||||||||||||||||
Net interest margin (1)(2) | 6.11% | 6.13% | 6.39% | 26 bps | 28 bps | 5.90% | 6.22% | 32 bps | ||||||||||||||||||
Risk-adjusted Net interest margin (1)(2) | 5.25% | 5.18% | 5.32% | 14 bps | 7 bps | 5.09% | 5.37% | 28 bps | ||||||||||||||||||
Funding cost (1)(2)(3) | 1.93% | 1.64% | 1.67% | 2 bps | -26 bps | 1.93% | 1.67% | -26 bps | ||||||||||||||||||
Loan portfolio quality | ||||||||||||||||||||||||||
Internal overdue ratio | 3.3% | 2.7% | 2.6% | -11 bps | -71 bps | 3.3% | 2.6% | -71 bps | ||||||||||||||||||
NPL ratio | 4.7% | 3.9% | 3.7% | -22 bps | -103 bps | 4.7% | 3.7% | -103 bps | ||||||||||||||||||
Coverage ratio of IOLs | 157.1% | 168.4% | 172.3% | 384 bps | 1514 bps | 157.1% | 172.3% | 1514 bps | ||||||||||||||||||
Coverage ratio of NPLs | 109.6% | 115.8% | 120.7% | 489 bps | 1105 bps | 109.6% | 120.7% | 1105 bps | ||||||||||||||||||
Cost of risk (4) | 1.3% | 1.4% | 1.6% | 14 bps | 30 bps | 1.2% | 1.3% | 3 bps | ||||||||||||||||||
Operating efficiency | ||||||||||||||||||||||||||
Operating expenses / Total income (5) | 39.9% | 38.5% | 39.1% | 54 bps | -86 bps | 38.7% | 38.8% | 8 bps | ||||||||||||||||||
Operating expenses / Total average assets (1)(2)(5) | 3.3% | 3.2% | 3.4% | 13 bps | 4 bps | 3.1% | 3.3% | 18 bps | ||||||||||||||||||
(1)Ratios are annualized.
(2)Averages are determined as the average of period-beginning and period-ending balances.
(3)The funding costs differs from previously reported due to a methodology change in the denominator, which no longer includes the following accounts: acceptances outstanding, reserves for property and casualty claims, reserve for unearned premiums, reinsurance payable and other liabilities.
(4)Cost of risk: Annualized provision for loan losses / Average total loans.
(5)Total income includes net interest income, fee income, net gain on foreign exchange transactions, result on exchange difference and net gain on derivatives. Operating expenses includes Salaries and social benefits, administrative, general and tax expenses and depreciation and amortization.
62
| | | Earnings Release 3Q / 2026 | Analysis of 3Q26 Consolidated Results | ||||||||
12. Appendix | |||||||||||
12.7.5. BCP Bolivia
BCP BOLIVIA
(In S/ Thousands, IFRS)
As of | % Change | ||||||||||||||||
| Sep 25 | Jun 26 | Sep 26 | QoQ | YoY | |||||||||||||
| ASSETS | |||||||||||||||||
| Cash and due from banks | 1,680,867 | 1,447,650 | 1,332,576 | -7.9% | -20.7% | ||||||||||||
| Investments | 892,962 | 1,303,605 | 1,278,175 | -2.0% | 43.1% | ||||||||||||
| Loans | 5,505,442 | 6,583,725 | 5,368,072 | -18.5% | -2.5% | ||||||||||||
| Current | 5,304,797 | 6,339,356 | 5,124,006 | -19.2% | -3.4% | ||||||||||||
| Internal overdue loans | 140,924 | 170,300 | 124,712 | -26.8% | -11.5% | ||||||||||||
| Refinanced loans | 59,721 | 74,069 | 119,354 | 61.1% | 99.9% | ||||||||||||
| Less - allowance for loan losses | (190,124) | (224,601) | (159,879) | -28.8% | -15.9% | ||||||||||||
| Loans, net | 5,315,318 | 6,359,125 | 5,208,193 | -18.1% | -2.0% | ||||||||||||
| Property, furniture and equipment, net | 69,397 | 79,685 | 63,200 | -20.7% | -8.9% | ||||||||||||
| Other assets | 184,907 | 245,292 | 217,647 | -11.3% | 17.7% | ||||||||||||
| Total assets | 8,143,451 | 9,435,357 | 8,099,791 | -14.2% | -0.5% | ||||||||||||
| LIABILITIES AND NET SHAREHOLDERS’ EQUITY | |||||||||||||||||
| Deposits and obligations | 6,934,203 | 8,181,166 | 7,048,908 | -13.8% | 1.7% | ||||||||||||
| Due to banks and correspondents | - | - | - | n.a. | n.a. | ||||||||||||
| Bonds and subordinated debt | 109,107 | 125,933 | 97,571 | -22.5% | -10.6% | ||||||||||||
| Other liabilities | 432,084 | 354,649 | 291,261 | -17.9% | -32.6% | ||||||||||||
Total liabilities | 7,475,394 | 8,661,748 | 7,437,740 | -14.1% | -0.5% | ||||||||||||
| Net equity | 668,057 | 773,609 | 662,051 | -14.4% | -0.9% | ||||||||||||
| TOTAL LIABILITIES AND NET EQUITY | 8,143,451 | 9,435,357 | 8,099,791 | -14.2% | -0.5% | ||||||||||||
Statement of Income
(S/ Thousands, IFRS)
Quarter | % Change | Up to | % Change | |||||||||||||||||||||||
| 3Q25 | 2Q26 | 3Q26 | QoQ | YoY | Sep 25 | Sep 26 | Sep 26 / Sep 25 | |||||||||||||||||||
| Interests income, net | 47,796 | 62,440 | 68,797 | 10.2% | 43.9% | 160,845 | 192,963 | 20.0% | ||||||||||||||||||
| Provisions for doubtful accounts receivable, net of recoveries | 3,686 | (16,262) | 63 | -100.4% | -98.3% | (13,099) | (30,137) | 130.1% | ||||||||||||||||||
| Net interest income after provisions | 51,482 | 46,178 | 68,860 | 49.1% | 33.8% | 147,746 | 162,826 | 10.2% | ||||||||||||||||||
| Non financial income | 47,804 | 75,557 | 20,415 | -73.0% | -57.3% | 139,557 | 163,478 | 17.1% | ||||||||||||||||||
| Total expenses | (72,016) | (76,004) | (64,328) | -15.4% | -10.7% | (210,615) | (201,618) | -4.3% | ||||||||||||||||||
| Translation result | 2,537 | 20,555 | 9,297 | -54.8% | 266.5% | 9,239 | 31,067 | 236.3% | ||||||||||||||||||
| Income tax | (7,147) | (13,699) | (6,956) | -49.2% | -2.7% | (24,810) | (31,310) | 26.2% | ||||||||||||||||||
| Net profit | 22,660 | 52,587 | 27,288 | -48.1% | 20.4% | 61,117 | 124,443 | 103.6% | ||||||||||||||||||
Selected Financial Indicators
| Quarter | Change | Up to | % Change | |||||||||||||||||||||||
| 3Q25 | 2Q26 | 3Q26 | QoQ | YoY | Sep 25 | Sep 26 | Sep 26 / Sep 25 | |||||||||||||||||||
| Efficiency ratio | 59.0% | 57.1% | 67.4% | 1027 bps | 835 bps | 65.5% | 62.8% | -273 bps | ||||||||||||||||||
| ROAE | 14.8% | 25.8% | 15.2% | -1059 bps | 36 bps | 9.7% | 21.7% | 1196 bps | ||||||||||||||||||
| L/D ratio | 79.4% | 80.5% | 76.2% | -435 bps | -324 bps | 79.4% | 76.2% | -324 bps | ||||||||||||||||||
| IOL ratio | 2.6% | 2.6% | 2.3% | -28 bps | -24 bps | 2.6% | 2.3% | -24 bps | ||||||||||||||||||
| NPL ratio | 3.6% | 3.7% | 4.5% | 85 bps | 90 bps | 3.6% | 4.5% | 90 bps | ||||||||||||||||||
| Coverage of IOLs | 134.9% | 131.9% | 128.2% | -370 bps | -671 bps | 134.9% | 128.2% | -671 bps | ||||||||||||||||||
| Coverage of NPLs | 94.8% | 91.9% | 65.5% | -2639 bps | -2925 bps | 94.8% | 65.5% | -2925 bps | ||||||||||||||||||
| Branches | 46 | 46 | 46 | 0 | 0 | |||||||||||||||||||||
| Agentes | 2,227 | 2,569 | 2,742 | 173 | 515 | |||||||||||||||||||||
| ATMs | 313 | 316 | 315 | -1 | 2 | |||||||||||||||||||||
| Employees | 1,908 | 2,007 | 2,095 | 88 | 187 | |||||||||||||||||||||
63
| | | Earnings Release 3Q / 2026 | Analysis of 3Q26 Consolidated Results | ||||||||
12. Appendix | |||||||||||
12.7.6. Mibanco
MIBANCO
(In S/ Thousands, IFRS)
As of | % Change | ||||||||||||||||
| Sep 25 | Jun 26 | Sep 26 | QoQ | YoY | |||||||||||||
| ASSETS | |||||||||||||||||
| Cash and due from banks | 2,109,302 | 1,811,137 | 1,870,795 | 3.3% | -11.3% | ||||||||||||
| Investments | 2,488,277 | 2,805,125 | 3,022,161 | 7.7% | 21.5% | ||||||||||||
| Total loans | 13,095,856 | 14,698,112 | 15,543,705 | 5.8% | 18.7% | ||||||||||||
| Current | 12,349,782 | 13,986,966 | 14,794,862 | 5.8% | 19.8% | ||||||||||||
| Internal overdue loans | 614,819 | 562,944 | 583,651 | 3.7% | -5.1% | ||||||||||||
| Refinanced | 131,255 | 148,202 | 165,192 | 11.5% | 25.9% | ||||||||||||
| Allowance for loan losses | (902,499) | (1,011,547) | (1,117,121) | 10.4% | 23.8% | ||||||||||||
| Net loans | 12,193,357 | 13,686,565 | 14,426,584 | 5.4% | 18.3% | ||||||||||||
| Property, plant and equipment, net | 124,994 | 118,172 | 119,984 | 1.5% | -4.0% | ||||||||||||
| Other assets | 636,681 | 748,339 | 815,685 | 9.0% | 28.1% | ||||||||||||
| Total assets | 17,552,611 | 19,169,338 | 20,255,209 | 5.7% | 15.4% | ||||||||||||
| LIABILITIES AND NET SHAREHOLDERS’ EQUITY | |||||||||||||||||
| Deposits and obligations | 10,897,835 | 11,444,411 | 11,908,904 | 4.1% | 9.3% | ||||||||||||
| Due to banks and correspondents | 2,418,667 | 2,687,415 | 2,807,651 | 4.5% | 16.1% | ||||||||||||
| Bonds and subordinated debt | 606,683 | 910,228 | 1,085,043 | 19.2% | 78.8% | ||||||||||||
| Other liabilities | 968,418 | 1,348,773 | 1,622,523 | 20.3% | 67.5% | ||||||||||||
| Total liabilities | 14,891,603 | 16,390,827 | 17,424,121 | 6.3% | 17.0% | ||||||||||||
| Net equity | 2,661,008 | 2,778,511 | 2,831,088 | 1.9% | 6.4% | ||||||||||||
| TOTAL LIABILITIES AND NET SHAREHOLDERS’ EQUITY | 17,552,611 | 19,169,338 | 20,255,209 | 5.7% | 15.4% | ||||||||||||
Statement of Income
(S/ Thousands, IFRS)
| Quarter | % Change | Up to | % Change | |||||||||||||||||||||||
| 3Q25 | 2Q26 | 3Q26 | QoQ | YoY | Sep 25 | Sep 26 | Sep 26 /Sep 25 | |||||||||||||||||||
| Net interest income | 632,469 | 707,035 | 734,868 | 3.9% | 16.2% | 1,816,400 | 2,119,836 | 16.7% | ||||||||||||||||||
| Provision for loan losses, net of recoveries | (167,975) | (184,269) | (220,577) | 19.7% | 31.3% | (495,928) | (571,818) | 15.3% | ||||||||||||||||||
| Net interest income after provisions | 464,494 | 522,766 | 514,291 | -1.6% | 10.7% | 1,320,472 | 1,548,018 | 17.2% | ||||||||||||||||||
| Non-financial income | 34,834 | 46,311 | 48,730 | 5.2% | 39.9% | 105,141 | 143,556 | 36.5% | ||||||||||||||||||
| Total expenses | (335,075) | (359,856) | (375,890) | 4.5% | 12.2% | (998,811) | (1,097,770) | 9.9% | ||||||||||||||||||
| Translation result | 54 | 277 | 132 | -52.3% | 144.4% | -774 | 610 | -178.8% | ||||||||||||||||||
| Income taxes | (42,430) | (54,716) | (46,897) | -14.3% | 10.5% | -107,222 | -150,961 | 40.8% | ||||||||||||||||||
| Net income | 121,877 | 154,782 | 140,366 | -9.3% | 15.2% | 318,806 | 443,453 | 39.1% | ||||||||||||||||||
Selected Financial Indicators
Quarter | % Change | Up to | % Change | |||||||||||||||||||||||
| 3Q25 | 2Q26 | 3Q26 | QoQ | YoY | Sep 25 | Sep 26 | Sep 26 /Sep 25 | |||||||||||||||||||
| Efficiency ratio | 49.4% | 46.8% | 46.9% | 11 bps | -255 bps | 51.4% | 47.6% | -379 bps | ||||||||||||||||||
| ROAE | 18.8% | 22.9% | 20.0% | -292 bps | 125 bps | 16.0% | 21.0% | 504 bps | ||||||||||||||||||
| ROAE incl. Goodwill | 17.8% | 21.8% | 19.1% | -274 bps | 126 bps | 15.1% | 20.0% | 484 bps | ||||||||||||||||||
| L/D ratio | 120.2% | 128.4% | 130.5% | 209 bps | 1035 bps | |||||||||||||||||||||
| IOL ratio | 4.7% | 3.8% | 3.8% | -8 bps | -94 bps | |||||||||||||||||||||
| NPL ratio | 5.7% | 4.8% | 4.8% | -2 bps | -88 bps | |||||||||||||||||||||
| Coverage of IOLs | 146.8% | 179.7% | 191.4% | 1171 bps | 4461 bps | |||||||||||||||||||||
| Coverage of NPLs | 121.0% | 142.2% | 149.2% | 694 bps | 2821 bps | |||||||||||||||||||||
Branches (1) | 282 | 282 | 282 | - | - | |||||||||||||||||||||
| Employees | 9,569 | 9,545 | 9,651 | 106 | 82 | |||||||||||||||||||||
(1)Includes Banco de la Nacion branches.
64
| | | Earnings Release 3Q / 2026 | Analysis of 3Q26 Consolidated Results | ||||||||
12. Appendix | |||||||||||
12.7.7. Prima AFP
Prima AFP
Statement of Financial Position
(In S/ Thousands, IFRS)
| As of | % Change | ||||||||||||||||
| Sep 25 | Jun 26 | Sep 26 | QoQ | YoY | |||||||||||||
| Cash and due from banks | 52,644 | 63,554 | 17,429 | -72.6% | -66.9% | ||||||||||||
| Non-interest bearing | 3,595 | 2,502 | 1,411 | -43.6% | -60.8% | ||||||||||||
| Interest bearing | 49,049 | 61,052 | 16,018 | -73.8% | -67.3% | ||||||||||||
| Fair value through profit or loss investments | 371,402 | 347,054 | 426,203 | 22.8% | 14.8% | ||||||||||||
| Fair value through other comprehensive income investments | 1,729 | 1,369 | 1,481 | 8.2% | -14.3% | ||||||||||||
Property, plant and equipment, net | 6,084 | 4,823 | 4,315 | -10.5% | -29.1% | ||||||||||||
Other Assets | 214,975 | 211,996 | 215,407 | 1.6% | 0.2% | ||||||||||||
| Total Assets | 646,834 | 628,796 | 664,835 | 5.7% | 2.8% | ||||||||||||
| Due to banks and correspondents | 4 | 6 | 15 | 150.0% | 275.0% | ||||||||||||
| Lease payable | 2,886 | 1,923 | 1,459 | -24.1% | -49.4% | ||||||||||||
| Other liabilities | 165,759 | 214,060 | 220,781 | 3.1% | 33.2% | ||||||||||||
| Total Liabilities | 168,649 | 215,989 | 222,255 | 2.9% | 31.8% | ||||||||||||
| Capital stock | 40,505 | 40,505 | 40,505 | 0.0% | 0.0% | ||||||||||||
| Reserves | 20,243 | 20,243 | 20,243 | 0.0% | 0.0% | ||||||||||||
| Other reserves | 909 | 1,338 | - | -100.0% | -100.0% | ||||||||||||
| Retained earnings | 304,309 | 257,992 | 259,295 | 0.5% | -14.8% | ||||||||||||
| Net Income for the Period | 112,219 | 92,729 | 122,537 | 32.1% | 9.2% | ||||||||||||
| Total Liabilities and Equity | 646,834 | 628,796 | 664,835 | 5.7% | 2.8% | ||||||||||||
Statement in Income
(In S/ Thousands, IFRS)
| Quarter | % Change | Up to | % Change | |||||||||||||||||||||||
| 3Q25 | 2Q26 | 3Q26 | QoQ | YoY | Sep 25 | Sep 26 | Sep 26 / Sep 25 | |||||||||||||||||||
| Financial income | 432 | 742 | 502 | -32.3% | 16.2% | 2,470 | 2,445 | -1.0% | ||||||||||||||||||
| Financial expenses | (910) | (649) | (638) | -1.7% | -29.9% | (1,881) | (2,259) | 20.1% | ||||||||||||||||||
| Interest income, net | (478) | 93 | (136) | -246.2% | -71.5% | 589 | 186 | -68.4% | ||||||||||||||||||
| Fee income | 95,006 | 94,901 | 93,532 | -1.4% | -1.6% | 286,311 | 279,628 | -2.3% | ||||||||||||||||||
| Net gain (loss) on securities | 19,532 | 30,026 | (1,345) | -104.5% | -106.9% | 20,770 | 44,329 | 113.4% | ||||||||||||||||||
| Net gain (loss) from exchange differences | 226 | 113 | 69 | -38.9% | -69.5% | 678 | 69 | -89.8% | ||||||||||||||||||
| Other income | 1,110 | 2,630 | 1,021 | -61.2% | -8.0% | 1,779 | 4,324 | 143.1% | ||||||||||||||||||
| Salaries and employee benefits | (23,947) | (23,627) | (23,576) | -0.2% | -1.5% | (72,256) | (72,033) | -0.3% | ||||||||||||||||||
| Administrative expenses | (18,686) | (17,633) | (19,082) | 8.2% | 2.1% | (58,469) | (56,877) | -2.7% | ||||||||||||||||||
| Depreciation and amortization | (7,078) | (7,399) | (6,328) | -14.5% | -10.6% | (20,918) | (20,971) | 0.3% | ||||||||||||||||||
| Other expenses | (267) | (948) | (481) | -49.3% | 80.1% | (1,026) | (1,693) | 65.0% | ||||||||||||||||||
| Profit before income tax | 65,418 | 78,156 | 43,674 | -44.1% | -33.2% | 157,458 | 176,962 | 12.4% | ||||||||||||||||||
| Income tax | (18,829) | (22,712) | (13,866) | -38.9% | -26.4% | (45,239) | (54,425) | 20.3% | ||||||||||||||||||
| Net profit | 46,589 | 55,444 | 29,808 | -46.2% | -36.0% | 112,219 | 122,537 | 9.2% | ||||||||||||||||||
Selected Financial Indicators
| Quarter | Change | Up to | % Change | |||||||||||||||||||||||
| 3Q25 | 2Q26 | 3Q26 | QoQ | YoY | Sep 25 | Sep 26 | Sep 26 / Sep 25 | |||||||||||||||||||
| ROE | 41.0% | 57.6% | 27.9% | -2972 bps | -1310 bps | 31.4% | 36.5% | 510 bps | ||||||||||||||||||
| Net Interest Margin | -0.5% | 0.1% | -0.1% | -21 bps | 36 bps | 0.2% | 0.1% | -13 bps | ||||||||||||||||||
| Efficiency Ratio | 52.5% | 51.2% | 52.4% | 125 bps | -5 bps | 52.7% | 53.6% | 82 bps | ||||||||||||||||||
| Operating Expenses / Total Average Assets | 32.2% | 30.1% | 30.3% | 17 bps | -193 bps | 31.0% | 29.6% | -137 bps | ||||||||||||||||||
Main Indicators and Market Share
| Prima | System | Share % | Prima | System | Share % | |||||||||||||||
| 2Q26 | 2Q26 | 2Q26 | 3Q26 | 3Q26 | 3Q26 | |||||||||||||||
| AUMs (S/ Millions) | 34,869 | 124,034 | 28% | 35,559 | 126,955 | 28% | ||||||||||||||
| Affiliates (S/ Millions) | 2,365,113 | 10,552,814 | 22% | 2,367,271 | 10,675,053 | 22% | ||||||||||||||
| Collections (S/ Millions) | 1,139 | 4,925 | 23% | 1,111 | 5,070 | 22% | ||||||||||||||
Source: Superintendencia de Banca, Seguros y AFPs.
65
| | | Earnings Release 3Q / 2026 | Analysis of 3Q26 Consolidated Results | ||||||||
12. Appendix | |||||||||||
12.7.8. Grupo Pacifico
Grupo Pacifico
(In S/ Thousands, IFRS)
| As of | % Change | ||||||||||||||||
| Sep 25 | Jun 26 | Sep 26 | QoQ | YoY | |||||||||||||
| Total assets | 20,594,428 | 21,434,137 | 21,596,739 | 0.8% | 4.9% | ||||||||||||
Total Invesment (1) | 14,661,176 | 15,230,023 | 15,453,287 | 1.5% | 5.4% | ||||||||||||
| Total Liabilities | 16,308,599 | 17,215,302 | 17,021,090 | -1.1% | 4.4% | ||||||||||||
| Net equity | 3,602,690 | 3,584,918 | 3,937,935 | 9.8% | 9.3% | ||||||||||||
Statement of Income
(S/ Thousands, IFRS)
| Quarter | % Change | Up to | % Change | |||||||||||||||||||||||
| 3Q25 | 2Q26 | 3Q26 | QoQ | YoY | Sep 25 | Sep 26 | Sep 26 /Sep 25 | |||||||||||||||||||
| Insurance Service Result | 359,462 | 295,078 | 282,344 | -4.3% | -21.5% | 979,953 | 798,560 | -18.5% | ||||||||||||||||||
| Reinsurance Result | (108,282) | (134,206) | (68,275) | -49.1% | -36.9% | (308,793) | (267,582) | -13.3% | ||||||||||||||||||
| Insurance underwriting result | 251,180 | 160,872 | 214,069 | 33.1% | -14.8% | 671,160 | 530,978 | -20.9% | ||||||||||||||||||
| Sale of medical services | 421,839 | 440,841 | 450,151 | 2.1% | 6.7% | 974,838 | 1,315,655 | 35.0% | ||||||||||||||||||
| Cost of sales of medical services | (297,919) | (307,396) | (313,757) | 2.1% | 5.3% | (684,824) | (921,973) | 34.6% | ||||||||||||||||||
| Medical services result | 123,920 | 133,445 | 136,394 | 2.2% | 10.1% | 290,014 | 393,682 | 35.7% | ||||||||||||||||||
| Interest income | 220,584 | 246,764 | 248,351 | 0.6% | 12.6% | 693,663 | 776,417 | 11.9% | ||||||||||||||||||
| Interest Expenses | (158,576) | (188,095) | (175,541) | -6.7% | 10.7% | (460,776) | (545,688) | 18.4% | ||||||||||||||||||
| Interest expenses attributable to insurance activities | (141,444) | (169,075) | (167,660) | -0.8% | 18.5% | (416,121) | (499,652) | 20.1% | ||||||||||||||||||
| Net Interest Income | 62,008 | 58,669 | 72,810 | 24.1% | 17.4% | 232,887 | 230,729 | -0.9% | ||||||||||||||||||
| Fee Income and Gain in FX | (5,160) | 660 | 74 | -88.8% | -101.4% | (15,708) | (5,065) | -67.8% | ||||||||||||||||||
| Other Income No Core: | ||||||||||||||||||||||||||
| Net gain (loss) from exchange differences | 1,454 | (837) | (499) | -40.4% | -134.3% | 1,591 | (1,996) | -225.5% | ||||||||||||||||||
| Net gain (loss) on securities and associates | (12,740) | 6,978 | 5,733 | -17.8% | -145.0% | (62,526) | 16,735 | -126.8% | ||||||||||||||||||
| Other Income not operational | 46,175 | 59,489 | 26,068 | -56.2% | -43.5% | 106,782 | 117,718 | 10.2% | ||||||||||||||||||
| Other Income | 29,729 | 66,290 | 31,376 | -52.7% | 5.5% | 30,139 | 127,392 | 322.7% | ||||||||||||||||||
| Operating expenses | (165,580) | (141,823) | (150,907) | 6.4% | -8.9% | (432,494) | (439,386) | 1.6% | ||||||||||||||||||
| Other expenses | (18,325) | (29,544) | (24,714) | -16.3% | 34.9% | (47,984) | (70,630) | 47.2% | ||||||||||||||||||
| Total Expenses | (183,905) | (171,367) | (175,621) | 2.5% | -4.5% | (480,478) | (510,016) | 6.1% | ||||||||||||||||||
| Income tax | (49,398) | (24,214) | (29,848) | 23.3% | -39.6% | (103,018) | (81,918) | -20.5% | ||||||||||||||||||
| Net income | 233,534 | 223,695 | 249,180 | 11.4% | 6.7% | 640,704 | 690,847 | 7.8% | ||||||||||||||||||
*Financial statements without consolidation adjustments.
(1)Excluding investments in real estate.
Up to February 2025, Grupo Pacifico’s financial statements reflect the agreement with Banmedica (in equal parts) of the businesses of:
(i)private health insurance managed by Grupo Pacifico and included in its Financial Statements in each of the accounting lines;
(ii)corporate health insurance (dependent workers); and
(iii)medical services.
The businesses described in ii) and iii) are managed by Banmedica, therefore they do not consolidate in Grupo Pacifico’s financial statements. The 50% of net income generated by Banmedica is recorded in Grupo Pacifico’s Income Statement as a gain/loss on investments in subsidiaries.
As explained before, corporate health insurance and medical services businesses are consolidated by Banmedica. The following table reflects the consolidated results from which Grupo Pacifico receives the 50% net income.
66
| | | Earnings Release 3Q / 2026 | Analysis of 3Q26 Consolidated Results | ||||||||
12. Appendix | |||||||||||
12.7.9. Investment Management & Advisory *
| Investment Management & Advisory * | Quarter | % Change | Up to | % Change | ||||||||||||||||||||||
| S/ 000 | 3Q25 | 2Q26 | 3Q26 | QoQ | YoY | Sep 25 | Sep 26 | Sep 26 / Sep 25 | ||||||||||||||||||
| Net interest income | 12,434 | (9,299) | (17,039) | 83.2% | -237.0% | 36,854 | (22,131) | -160.1% | ||||||||||||||||||
| Other income | 260,937 | 337,289 | 321,765 | -4.6% | 23.3% | 757,973 | 953,163 | 25.8% | ||||||||||||||||||
| Fee income | 161,004 | 182,529 | 192,974 | 5.7% | 19.9% | 458,414 | 550,098 | 20.0% | ||||||||||||||||||
| Net gain on foreign exchange transactions | 17,871 | 30,527 | 27,263 | -10.7% | 52.6% | 54,437 | 87,838 | 61.4% | ||||||||||||||||||
| Net gain on sales of securities | 107,080 | 188,188 | 65,959 | -65.0% | -38.4% | 212,570 | 301,569 | 41.9% | ||||||||||||||||||
| Derivative Result | (32,934) | (76,963) | 37,384 | -148.6% | -213.5% | (37,859) | (33,388) | -11.8% | ||||||||||||||||||
| Result from exposure to the exchange rate | 4,028 | 9,234 | (2,043) | -122.1% | -150.7% | 21,497 | 6,905 | -67.9% | ||||||||||||||||||
| Other income | 3,888 | 3,774 | 228 | -94.0% | -94.1% | 48,914 | 40,141 | -17.9% | ||||||||||||||||||
Operating expenses (1) | (190,831) | (223,539) | (245,319) | 9.7% | 28.6% | (576,601) | (712,508) | 23.6% | ||||||||||||||||||
| Operating income | 82,540 | 104,451 | 59,407 | -43.1% | -28.0% | 218,226 | 218,524 | 0.1% | ||||||||||||||||||
| Income taxes | (21,056) | (28,689) | (14,225) | -50.4% | -32.4% | (43,840) | (54,665) | 24.7% | ||||||||||||||||||
| Non-controlling interest | 142 | 133 | 121 | -9.0% | -14.8% | 461 | 393 | -14.8% | ||||||||||||||||||
| Net income | 61,342 | 75,629 | 45,061 | -40.4% | -26.5% | 173,925 | 163,466 | -6.0% | ||||||||||||||||||
* Includes ASB and Credicorp Capital. Does not include Wealth Management at BCP.
(1)Includes: Salaries and employee benefits + Administrative expenses + Assigned expenses + Depreciation and amortization + Tax and contributions + Other expenses.
67
| | | Earnings Release 3Q / 2026 | Analysis of 3Q26 Consolidated Results | ||||||||
12. Appendix | |||||||||||
12.8. Table of calculations
Table of calculations (1) | ||||||||
| Profitability | Interest earning assets | Cash and due from banks+Total investments+Cash collateral, reverse repurchase agreements and securities borrowing+Loans | ||||||
| Funding | Deposits and obligations+Due to banks and correspondents+BCRP instruments+Repurchase agreements with clients and third parties+Bonds and notes issued | |||||||
| Net Interest Margin (NIM) | (Net Interest Income (excluding Net Insurance Financial Expenses) (Average Interest Earning Assets) | |||||||
| Risk-adjusted Net Interest Margin (Risk- adjusted NIM) | (Annualized Net Interest Income (excluding Net Insurance Financial Expenses) - Annualized Provisions ) (Average period end and period beginning interest earning assets ) | |||||||
| Funding cost | (Interest Expense (Does not Include Net Insurance Financial Expenses) (Average Funding ) | |||||||
| Core income | Net Interest Income+Fee Income+Net Gain on Foreign exchange transactions | |||||||
| Other core income | Fee Income+Net Gain on Foreign exchange transactions | |||||||
| Other non-core income | Net Gain Securities+Net Gain from associates+Net Gain of derivatives held for trading+Net Gain from exchange differences+Other non operative income | |||||||
| Return on average assets (ROA) | (Annualized Net Income attributable to Credicorp) (Average Assets) | |||||||
| Return on average equity (ROE) | (Annualized Net Income attributable to Credicorp) (Average Net Equity) | |||||||
| Portfolio quality | Internal overdue ratio | (Internal overdue loans) (Total Loans) | ||||||
| Non – performing loans ratio (NPL ratio) | (Internal overdue loans+Refinanced loans) (Total Loans) | |||||||
| Coverage ratio of internal overdue loans | (Allowance for loans losses) (Internal overdue loans) | |||||||
| Coverage ratio of non – performing loans | (Allowance for loans losses) (Non-performing loans) | |||||||
| Cost of risk | (Annualized provision for credit losses on loans portfolio, net of recoveries ) (Average Total Loans) | |||||||
| Operating performance | Operating expenses | Salaries and employees benefits+Administrative expenses+Depreciation and amortization+Association in participation +Acquisition cost | ||||||
| Operating Income | Net interest, similar income, and expenses+Fee income+Net gain on foreign exchange transactions+Net gain from associates+Net gain on derivatives held for trading+Net gain from exchange differences+Net Insurance Underwriting Results | |||||||
| Efficiency ratio | Salaries and employee benefits + Administrative expenses + Depreciation and amortization + Association in participation Net interest, similar income and expenses + Fee Income + Net gain on foreign exchange transactions + Net gain from associates+Net gain on derivatives held for trading + Result on exchange differences+Insurance Underwriting Result | |||||||
| Capital Adequacy | Liquidity Coverage ratio | Total High Quality Liquid Assets + Min(Total Inflow 30 days; 75% * Total Outflow 30 days) Total Outflow 30 days | ||||||
| Regulatory Capital ratio | (Regulatory Capital) (Risk -weighted assets) | |||||||
| Tier 1 ratio | Tier 1(2) Risk -weighted assets | |||||||
Common Equity Tier 1 ratio (3) | Capital+Reserves -100% of applicable deductions (4)+ Retained Earnings+Unrealized gains or losses Risk -weighted assets | |||||||
(1)Averages are determined as the average of period-beginning and period-ending balances.
(2)Includes investment in subsidiaries, goodwill, intangibles, and deferred tax that rely on future profitability.
(3)Common Equity Tier 1 = Capital Stock + Reserves + Accumulated earnings – Unrealized profits or losses - 100% deductions (investment in subsidiaries, goodwill, intangible assets, and deferred tax assets based on future returns).
(4)Includes investment in subsidiaries, goodwill, intangible assets, and deferred taxes based on future returns.
68
| | | Earnings Release 3Q / 2026 | Analysis of 3Q26 Consolidated Results | ||||||||
12. Appendix | |||||||||||
12.9. Glossary of terms
| Term | Definition | ||||||||||
| AFP | Administradora de Fondo de Pensiones or Private Pension Funds Administrators | ||||||||||
| BCRP | Banco Central de Reserva del Perú or Peruvian Central Bank | ||||||||||
| Financially Included | Stock of financially included clients through BCP since 2020. New clients with BCP savings accounts or new Yape affiliates that: (i) Do not have debt in the financial system nor other BCP products in the 12 months prior to their inclusion, and (ii) Have performed at least 3 monthly transactions on average through any BCP channel in the last 3 months | ||||||||||
| GMV | Gross Merchant Volume | ||||||||||
| Government Program Loans (“GP” or “GP Loans”) | Loan Portfolio related to Reactiva Peru, FAE-Mype and Impulso Myperu programs to respond quickly and effectively to liquidity needs and maintain the payment chain | ||||||||||
| MAU | Monthly Active Users | ||||||||||
| MEF | Ministry of Economy and Finance of Peru | ||||||||||
| TPV | Total Payment Volume | ||||||||||
69